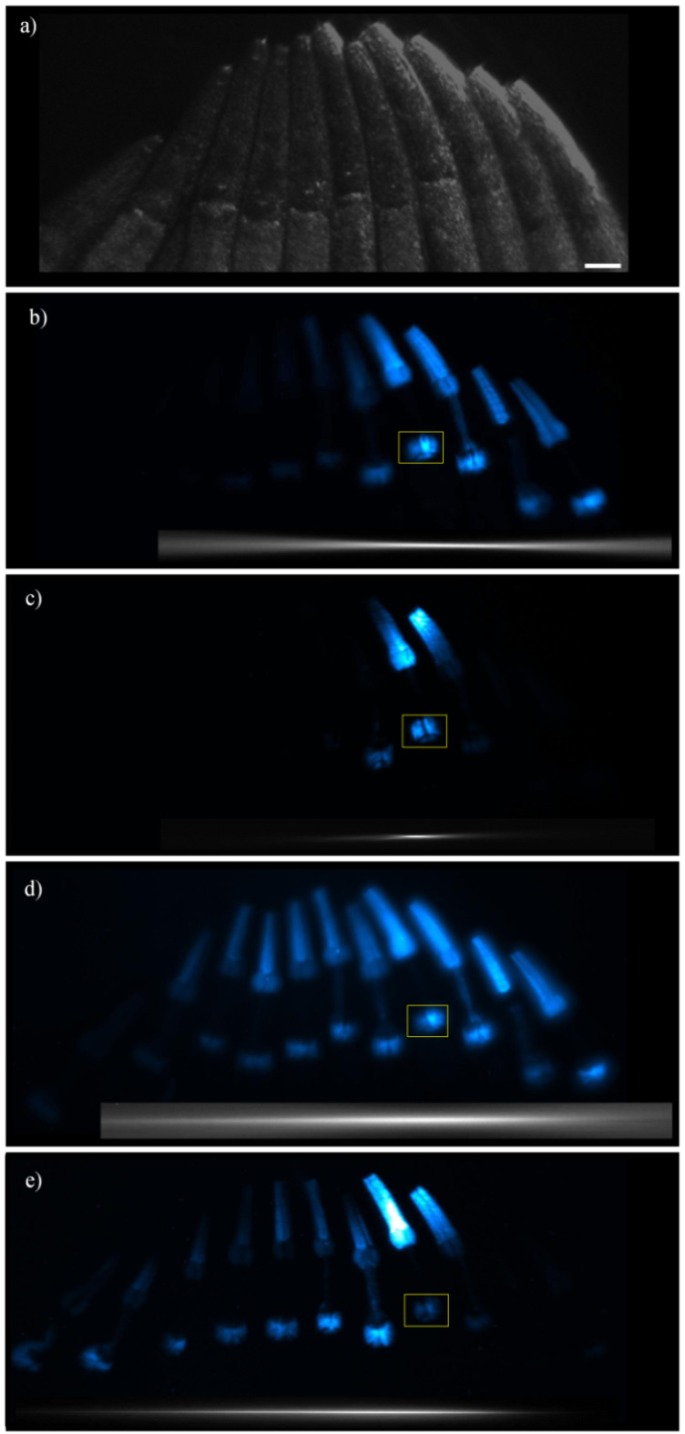
Figure 6.
Fluorescent images of a row of C. elegans aligned along the x direction. Figure a) shows the sample configuration as a reference (image taken using oblique illumination). Figures (b-e) are maximum intensity projections of z stacks taken with the four modalities available in our setup: b) DSLM-Gauss, c) 2p-DSLM-Gauss, d) DSLM-Bessel and e) 2p-DSLM-Bessel. The insets below each image indicate the position and extension of the excitation focal lines of Fig. 2. All z-stacks are composed of 50 images taken in steps of 2 μm. Scale bars: 50 μm.

