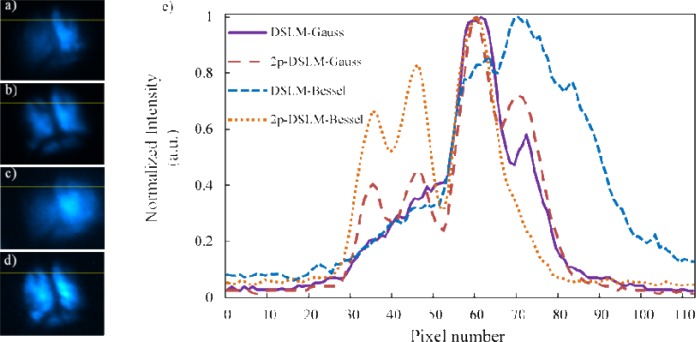
Figure 7.
Normalized profiles along a selected line taken from approximately the same optical section for all the DSLM modalities. Optical sections showing the same ROI and the selected line in yellow for a) DSLM with Gaussian beams, b) 2p-DSLM with Gaussian beams, c) DSLM with Bessel beams, and d) 2p-DSLM with Bessel beams. Plots of the intensity profiles along the selected lines are shown in e). Intensity of each plot has been normalized to its respective maximum value.

