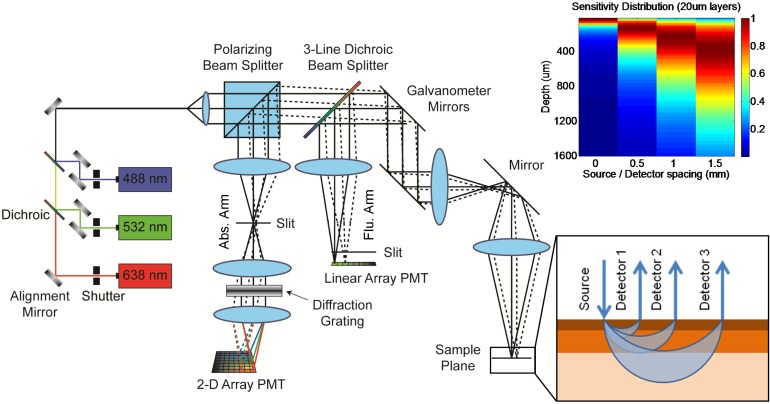
Fig. 1.
Schematic diagram of Laminar Optical Tomography system. lower inset: illustration of offset detector geometry and average photon pathways in tissue (blue arcs). Note that wider detector offsets yield deeper average photon migration pathways. Upper inset: Monte Carlo-derived depth sensitivity of LOT measurements at four source-detector offset positions for optical properties approximating skin (normalized to 1 for each offset).

