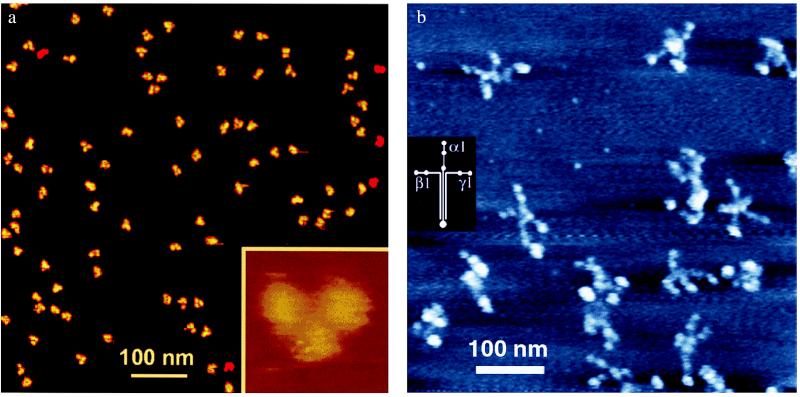
Figure 1.
(a) AFM of IgG antibody molecules under aqueous fluid. IgG molecules were imaged by using the fluid “Tapping Mode” at low amplitude on cantilever resonance. Imaging buffer: 10 mM NaOAc, pH 4.0. Scan size: 700 nm (large field) or 30 nm (Inset). The image was provided by D. Anafi and G.-M. Wu (Amgen Biologicals, Thousand Oaks, CA) and was taken from http://www.di.com (Digital Instruments, Veeco Metrology Group, Santa Barbara, CA). (b) Field laminin molecules in air, taken by AFM. Varied conformations of laminin-1 molecules show the large globular domain at the end of the long arm of the cross and two small globular domains on the ends of many of the short arms. For imaging conditions, see ref. 23. The diagram of laminin-1 chains was derived from electron microscopy, proteolytic degradation, and amino acid sequencing; Molecular mass is 900 kDa (32).

