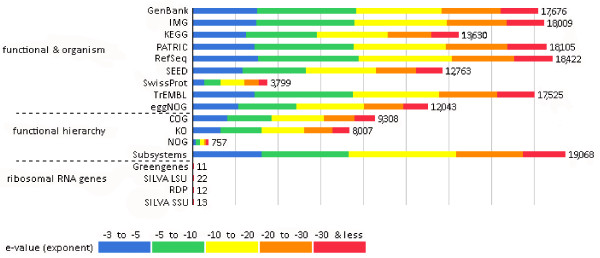
Figure 1.
Source hit distribution. Legend: The graph displays the number of features in our examined dataset that were annotated by the different databases: GenBank- National Institutes of Health Genetic Sequence Database, IMG- Integrated Microbial Genomes at the Joint Genome Institute, KEGG- Kyoto Encyclopedia of Genes and Genomes, PATRIC- Pathosystems Resource Integration Center, RefSec- National Center for Biotechnology Information Reference Sequences Database, SEED- The SEED Project, SwissProt- Swiss-Prot Uniport Knowledgebase, TrEMBL- TrEMBL Uniport Knowledgebase, eggNOG- evolutionary genealogy of genes: Non-supervised Orthologous Groups, COG- eggNOG: Clusters of Orthologous Groups, KO- KEGG Orthology, NOG- eggNOG: Non-supervised Orthologous Groups, Subsystems- SEDD Subsystem Annotation, Greengenes- 16 S rRNA Gene Database, SILVA LSU- SILVA Large Subunit rRNA Database, RDP- Ribosomal Database Project, SILVA SSU- SILVA Small Subunit rRNA Database. The bars represent annotated reads, which are colored according to their e-value range

