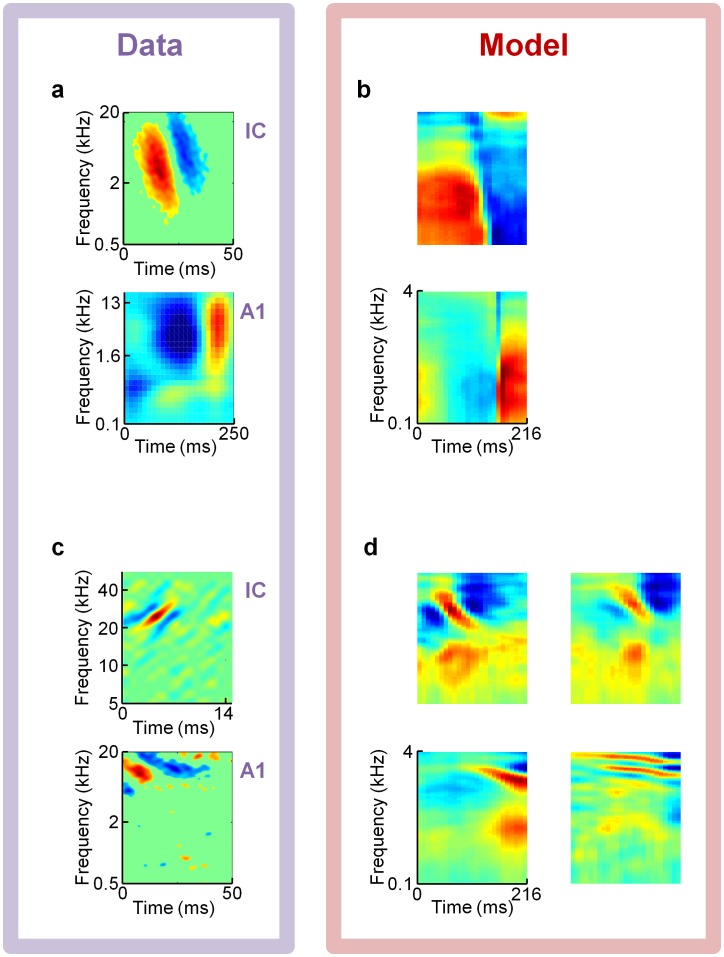
Figure 8. Model comparisons to receptive fields from auditory midbrain and cortex.
on spectrograms of speech predicts several classes of broadband spectro-temporal receptive field (STRF) shapes found in Inferior Colliculus (IC) and primary auditory cortex (A1). (a,b) An example broadband OFF-type STRF from cat IC [34] (top; data courtesy of M.A. Escabí) and an example broadband ON-type subthreshold STRF from rat A1 [35] (bottom; data courtesy of M. Wehr) shown in panel a resemble example elements from a four-times overcomplete, L0-sparse, spectrogram-trained dictionary shown in panel b. (c) STRFs from a bat IC neuron [32] (top; data courtesy of S. Andoni) and a cat A1 neuron [34] (bottom; data courtesy of M.A. Escabí) each consist of a primary excitatory subfield that is modulated in frequency over time, flanked by similarly angled suppressive subfields. (d) Example STRFs from four elements taken from the same dictionary as in panels b exhibit similar patterns as the neuronal STRFs in panel c.

