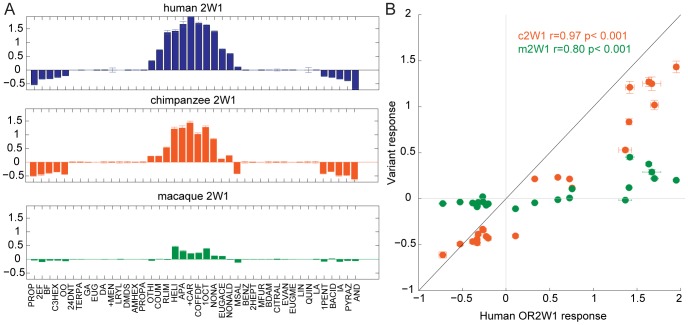
Figure 2. Response of OR orthologs to 42 chemically diverse odors.
(A) Tuning curves of human, chimp and macaque OR2W1 orthologs tested against 42 odors using a cAMP-mediated luciferase assay [26]. Odorants are ordered along the x-axis according to the response elicited from the human OR2W1, with the best ligands closer to the center. Y-axis represents the luciferase response to an odor at 100 µM (n = 3, ± S.E.). Negative values on the y-axis indicate the odor elicited an inhibitory response on OR signaling. See Figure S6 for additional tuning curves. (B) Response of chimp and macaque OR2W1 orthologs (variant responses) plotted against the human OR2W1 response using the data from (A). X-axis and y-axis are response in luciferase assay at 100 µM (n = 3, ± S.E.). The black line represents the unit-slope line. Odor abbreviations in Table S3.

