
Figure 4. Dose-response curves of an OR ortholog set to a given ligand.
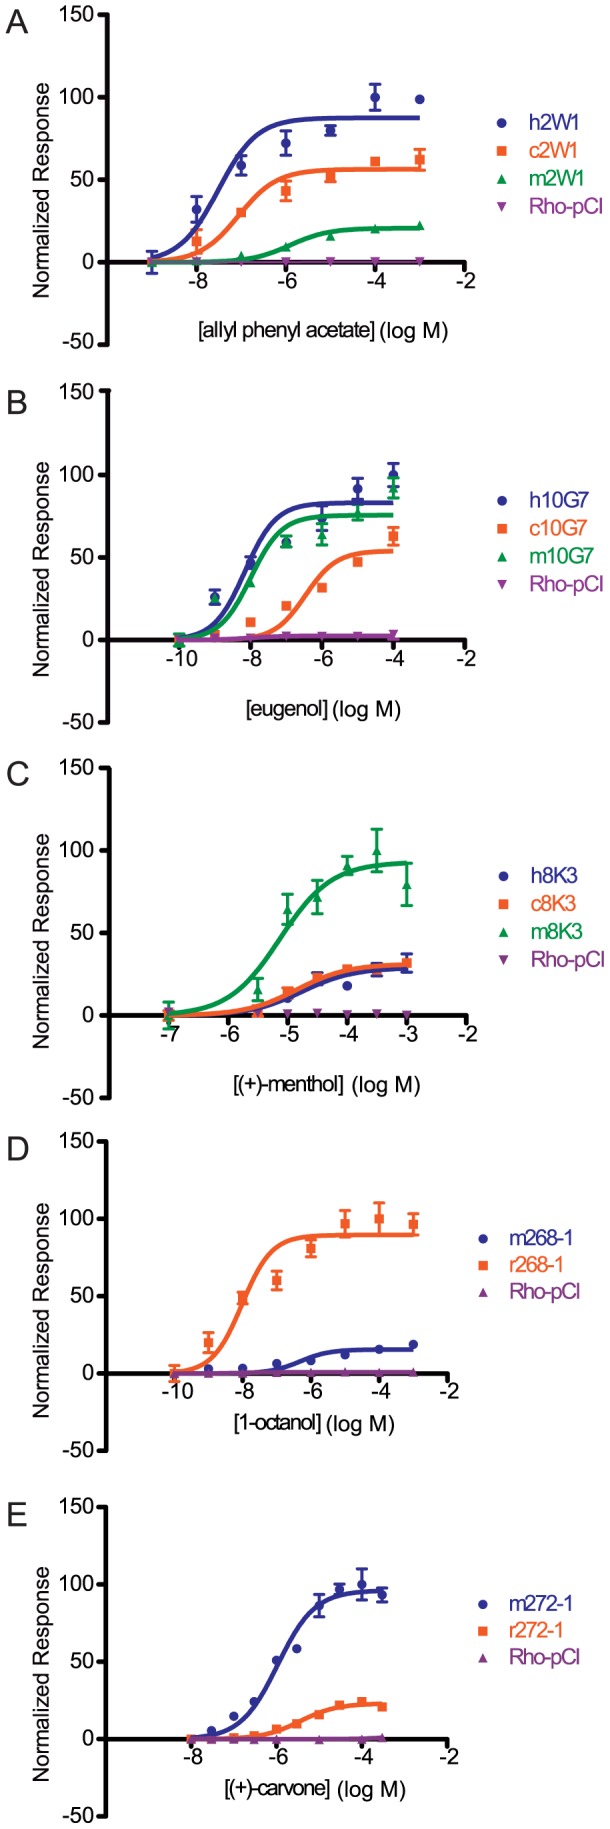
(A) Primate OR2W1 orthologs to allyl phenyl acetate. (B) Primate OR10G7 orthologs to eugenol. (C) Primate OR8K3 orthologs to (+)-menthol. (D) Rodent 268-1 orthologs to 1-octanol. (E) Rodent 272-1 orthologs to (+)-carvone. X-axis is the concentration of a given odor in Log Molar. Y-axis is normalized response (n = 3, ± S.E.M.). Human (h), chimpanzee (c) and rhesus macaque (m) in primate ortholog sets; mouse (m) and rat (r) for rodent ortholog sets. Vector control is Rho-pCI. See Figure S9 for additional dose-response data.