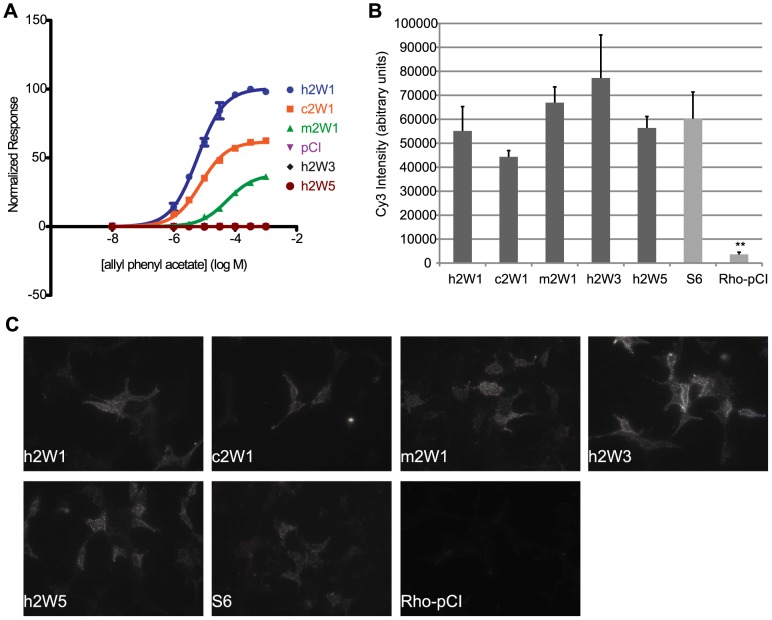
Figure 8. Cell surface expression does not predict function of ORs.
(A) Primate OR2W1 orthologs and 2W subfamily members to allyl phenyl acetate. (B) Quantification of live cell-surface expression of each receptor. ** p<0.01 when compared to hOR2W1. Y-axis denotes the average Cy3 intensity in arbitrary units (a.u.) (n = 3, ± S.E.M.). S6 is positive control and Rho-pCI is negative control. (C) Representative image of live cell-surface staining for each receptor. For additional live-cell surface staining, see Figure S13, Table S7.

