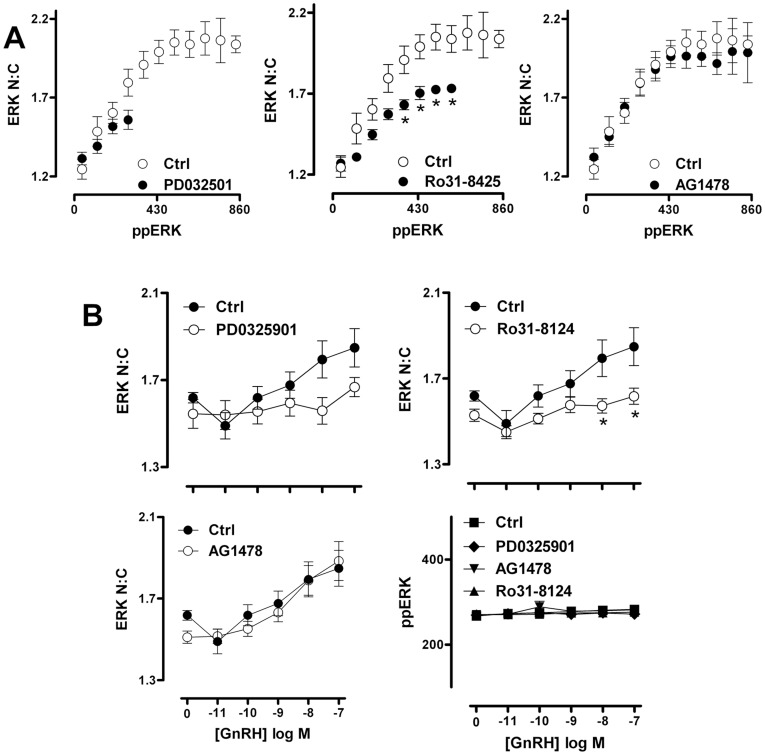
Figure 2. GnRH-stimulated MEK-ERK regulation in cell populations.
HeLa cells were cultured, transduced, stimulated with 0, 1 nM or 100 nM GnRH and then fixed and stained as described under Fig. 1. Images of endogenous ppERK, ERK and DAPI stains were analysed (as described in Methods), using 9 images for each fluorophore and in each well, with cells in duplicate wells for each experiment. Graphs represent population average values for ppERK intensity (in arbitrary fluorescence units (AFU), left panels) and ERK N:C ratio (derived from AFU measures of total ERK stain intensity in the nuclear and cytoplasmic compartments) derived from 8 (A) and 14 (B) separate experiments ± SEM. Two way ANOVAs of data in panel A revealed GnRH as a significant source of variation (P<0.01) and post-hoc Bonferroni tests revealed significant differences between control and GnRH-treated cells as indicated (*P<0.05, **P<0.01). One way ANOVA of data in panel B revealed GnRH as a significant source of variation (P<0.01) and post-hoc Bonferroni tests revealed significant differences to control as indicated (*P<0.05, **P<0.01).

