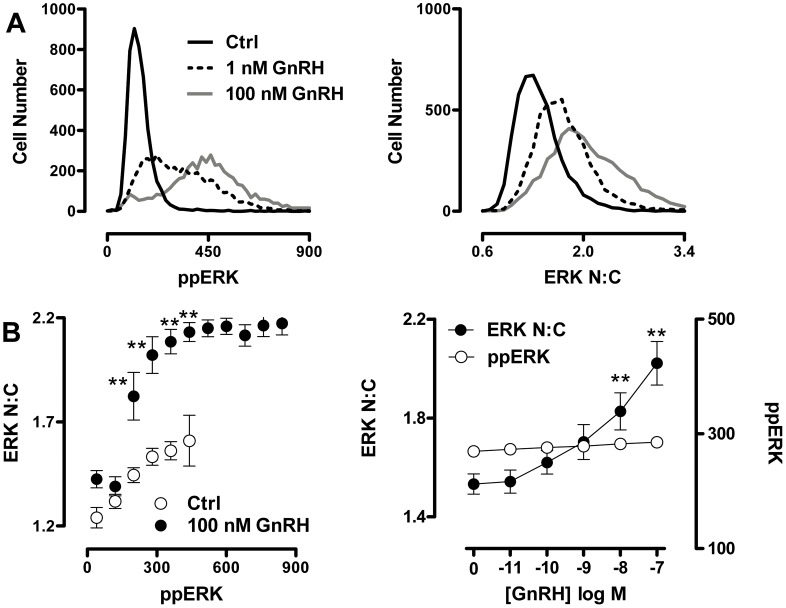
Figure 3. GnRH-mediated uncoupling of ERK phosphorylation from nuclear localization.
Cells were treated, imaged and analysed as described for Fig. 2, except that the stimulation was for 5 min with varied concentrations of GnRH (as indicated). (A) Frequency histograms of individual cells (pooled from 2 independent experiments) were plotted according to ppERK stain intensity in AFU (left panel) and ERK N:C ratio (right panel) using the same cell population for both graphs. (B) The left panel shows direct comparison of ppERK levels to ERK N:C in Ctrl and 100 nM GnRH-stimulated samples. Individual cells were sorted into bins of ppERK staining intensity (80 AFU per bin, using a minimum bin size of 50 cells per experiment). The average ERK N:C ratio within each defined bin of ppERK staining intensity was calculated and is shown plotted against average ppERK stain intensity. Note that this plot effectively obscures the effect of the stimulus on ERK phosphorylation because the major effect of PDBu is to increase the number of cells in the higher ppERK bins (as shown in A). In doing so it reveals the TEY phosphorylation unattributable effect of PDBu: that is, the increase in ERK N:C under conditions matched for indistinguishable ppERK levels. The right hand panel illustrates the concentration-dependence of this effect with cells binned to ensure comparable levels of ppERK (240–320 AFU), plotting GnRH concentration against ERK N:C ratio (left y-axis)) and ppERK stain intensity (AFU, right y-axis). Data are shown from 13 separate experiments (mean ± SEM). Two way ANOVA of data in the lower left panel revealed both ppERK bin and GnRH concentration as significant sources of variation (P<0.01) and post-hoc Bonferroni tests revealed significant differences between control and GnRH-treated cells in the 200, 280, 360 and 440 AFU bins (**P<0.01). Since this analysis does not permit unpaired data, only data from the first six ppERK bins were included. One way ANOVA of the ppERK data in the lower right panel revealed GnRH concentration as a significant source of variation (P<0.01) and post-hoc Bonferroni tests revealed a significant difference between control and 10 or 100 nM GnRH-treated cells (**P<0.01).

