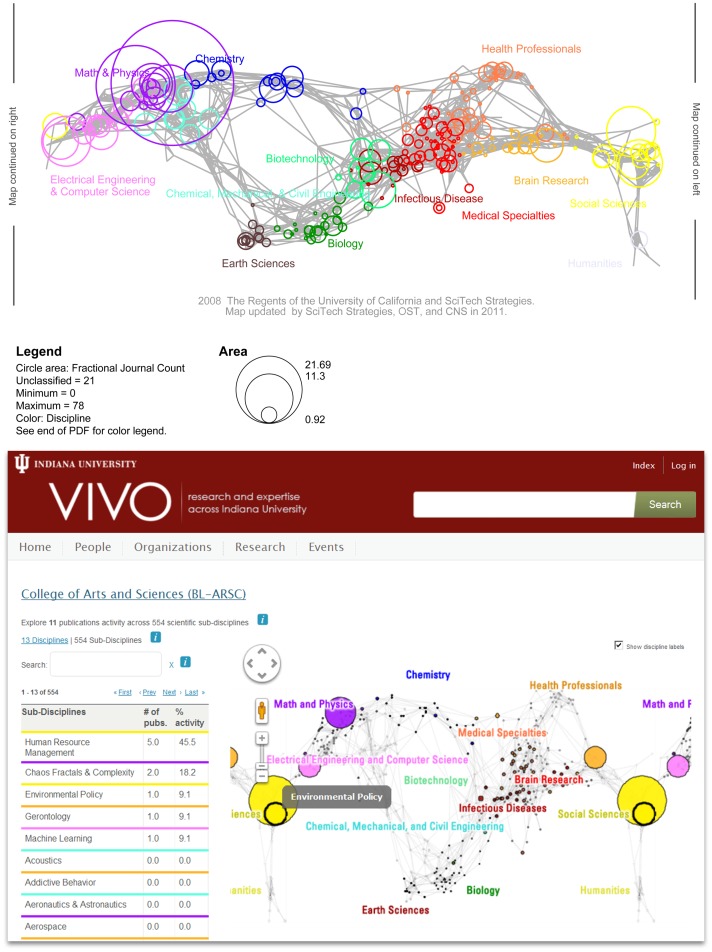
Figure 3. UCSD Map of Science visualizations in Sci2 desktop tool (top) and on VIVO web page (bottom).
The left map shows the expertise coverage of four network science researchers, see Sci2 tutorial for details. The right map features the expertise coverage of the College of Arts and Sciences at Indiana University Bloomington. The interactive map is available online at http://vivo.iu.edu/vis/map-of-science/BL-ARSC).

