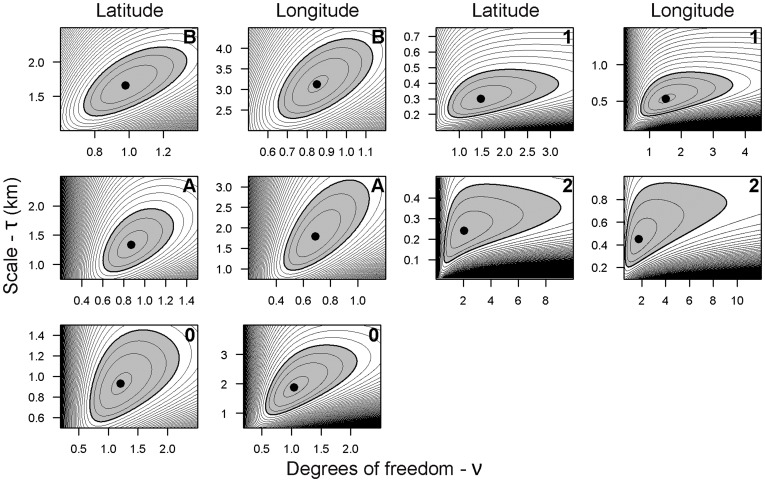
Figure 3. Joint log-likelihood surface plots for t distribution parameters τ and ν, for the longitude and latitude components of error.
Argos location classes are indicated in the lower right corner of each panel. Maximum likelihood estimates are represented by filled circles. The 95% confidence region on each panel is indicated in gray and delimitated by a thick black line. The contour interval is -1 with log-likelihood values decreasing from the maximum likelihood point estimate.

