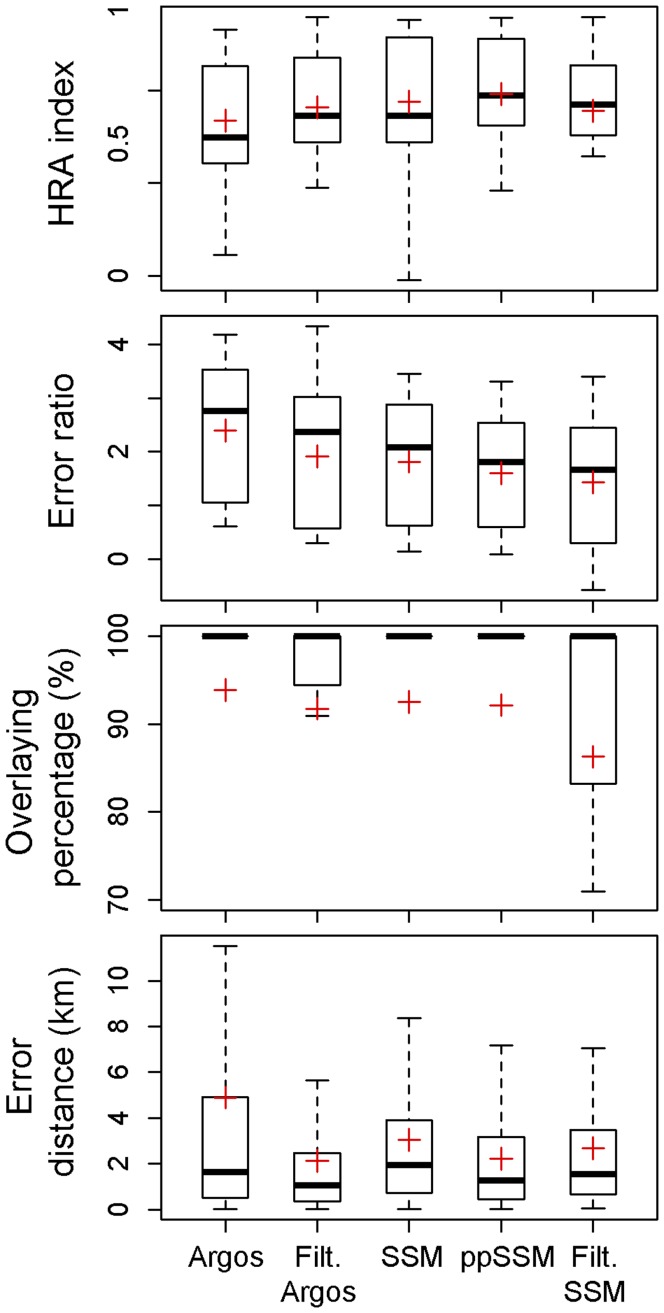
Figure 5. Box and whisker plots of the Home Range Accuracy (HRA) index, error ratio (log10 transformed), overlaying percentage (%), and error distance (km) computed using five Argos-derived location estimates.
Red crosses indicate mean values. ppSSM – post-processed state-space model. Outliers are not represented.

