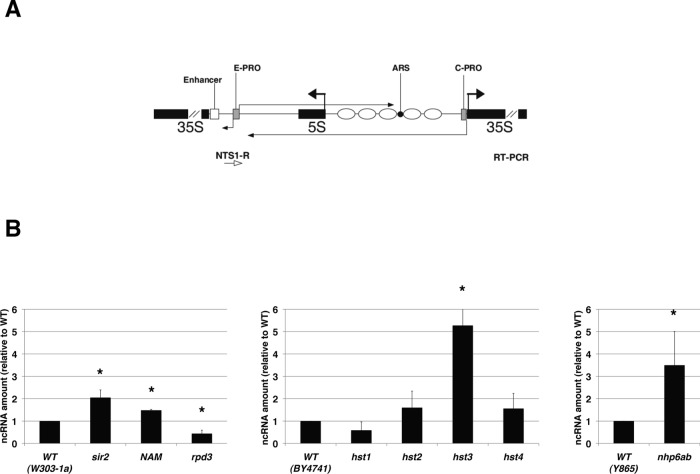
FIGURE 3:
ERC formation is stimulated by ncRNA transcription. (A) Schematic map of the rDNA unit. Thin horizontal black arrows, ncRNAs produced from E-PRO and C-PRO promoters. Horizontal white arrow, oligo NTS1-R used in the strand-specific RT-PCR. (B) Quantification of the ncRNA expression level. The histograms indicate the averages and SDs from three independent experiments. Two-tailed t-test was applied for statistical analysis. Asterisks indicate statistically relevant differences; α = 0.05. The p values are as follows: sir2, p = 0.0006; NAM, p = 0.002; rpd3, p = 0.0013; hst1, p = 0.0703; hst2, p = 0.1451; hst3, p = 0.0047; hst4, p = 0.125; nhp6ab, p = 0.0454.

