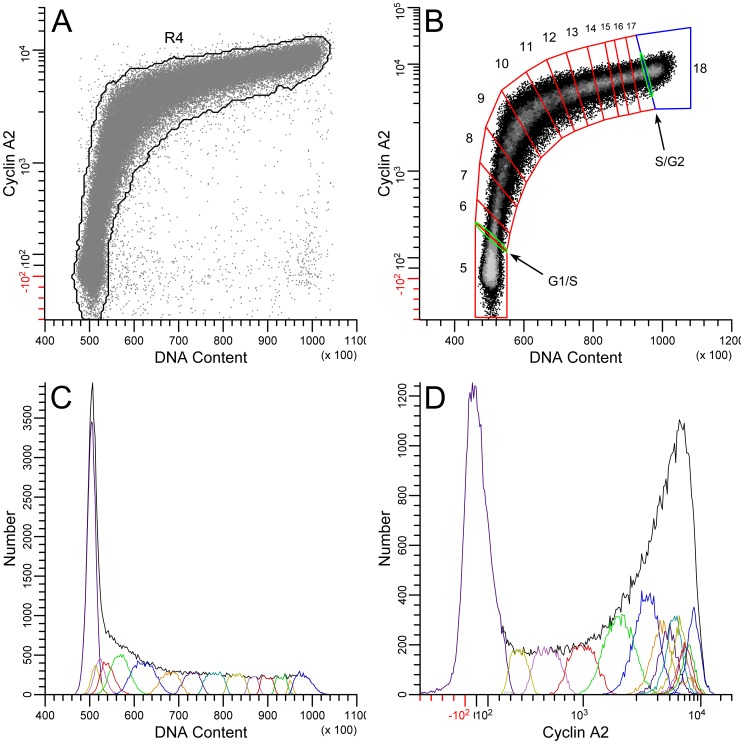
Figure 2. Gating and segmenting interphase.
Data were first gated on single cells cells from 2C to 4C in DNA content (not shown) AND (Boolean) R3 ( Figure 1 ). (A) R4 creates the final gate for interphase. The purpose is to eliminate endoreduplicated or binucleate G1 cells, cyclin A2-negative S phase cells, and outliers. (B) Region 5 has been set on G1 cells. S phase has been segmented into regions 5–17, which follow the two dimensional modal backbone of the data. The adjacent boundaries of each region were originally set to be orthogonal to the local slope of the data and then adjusted to create Gaussian character, observed in single parameter histograms of DNA content (C) and cyclin A2 (D). G2 cells are bounded by region 18 (blue), and thin, oval regions (G1/S, S/G2) were set on the boundaries between G1 and S and S and G2 (green).

