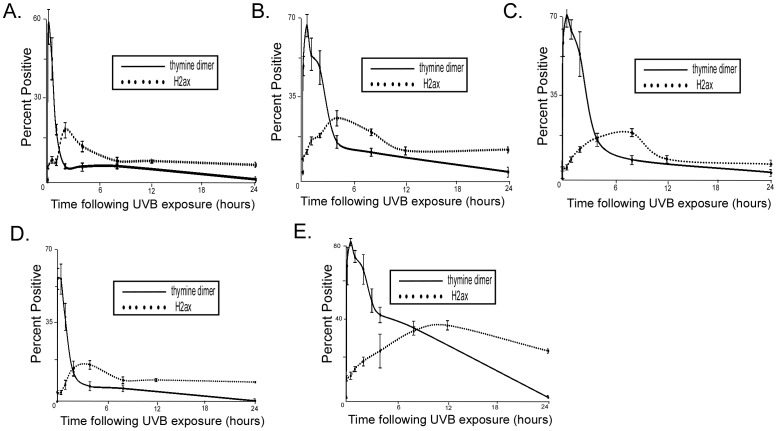
Figure 2. Temporal relationship between thymine dimer and phospho H2AX detection.
HFK cells were exposed to 10 mJ/cm2 UVB and immunofluorescence was used to measure the percentage of cells positive for thymine dimers and phospho H2AX above background. Graph shows percentage of HFK cells staining positive for either thymine dimers (solid line) or phospho H2AX (dotted line) after indicated period of time following exposure to 10 mJ/cm2 UVB. A. LXSN HFK cells B. 5 E6 HFK cells C. HPV 8 E6 HFK cells D. HPV 38 E6 HFK cells E. HPV 16 E6 HFK cells. n≥5. Error bars represent standard errors of the mean.

