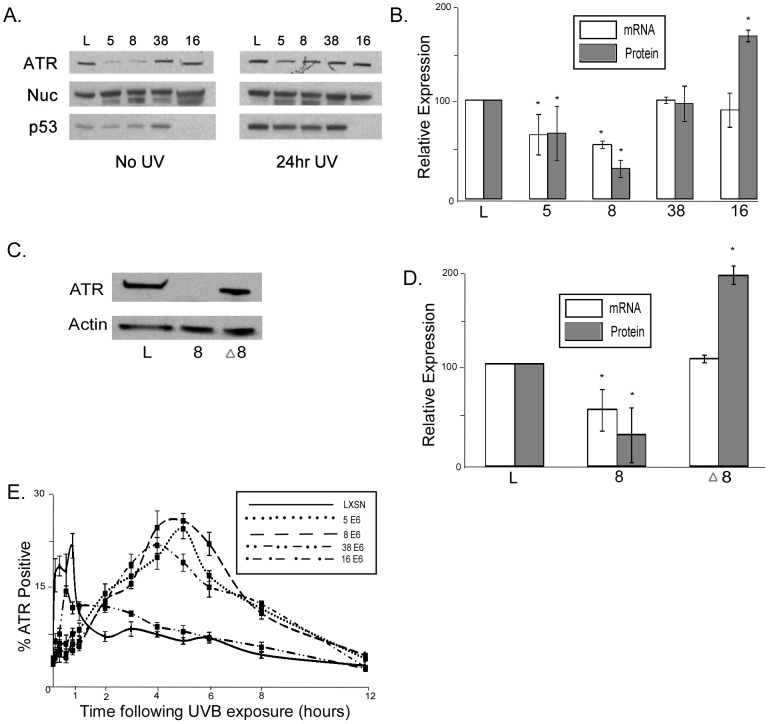
Figure 5. HPV E6 expression decreases ATR expression and activity.
A. Representative immunoblot showing ATR protein levels in HFK cells either untreated or exposed to 10 mJ/cm2 UVB. p53 is shown as a control for HPV 16 E6 expression, which results in p53 degradation. Nuc denotes Nucleolin. B. Densitometry of immunoblots (n = 3) and measurements by quantitative RT-PCR of ATR mRNA levels (n = 3) in HPV E6 expressing HFK cells. Levels were normalized to GAPdh (mRNA) and Nucleolin (protein) for each experiment. Error bars represent standard errors of the mean. * denotes a statistically significant difference from LXSN cells. C. Representative immunoblot showing ATR protein levels in HFK cells exposed to 10 mJ/cm2 UVB. D. Densitometry of immunoblots (n = 3) and measurements by quantitative RT-PCR of ATR mRNA levels (n = 3) in HPV E6 expressing HFK cells. Levels were normalized to GAPdh (mRNA) or β Actin (protein) for each experiment. Error bars represent standard errors of the mean. * denotes a statistically significant difference from LXSN cells. E. ATR foci formation was measured using immunofluorescence following 10 mJ/cm2 UVB exposure. Graph shows percentage of cells positive for ATR foci, above background levels.

