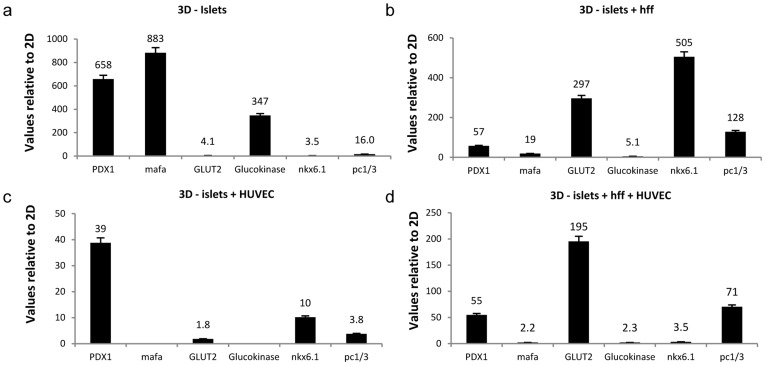
Figure 4. Expression profiles of EC morphogenesis-related genes.
Quantitative real-time PCR analyses, using human specific primers were performed on islet-EC settings following their culture (a) with HFF in a 3D co-culture system or (b) with HFF in a 2D co-culture system. (c) Relative gene expression between 3D/2D multicellular culture systems. (d) Relative gene expression between 3D/2D co-culture systems. Values were normalized to human GAPDH.

