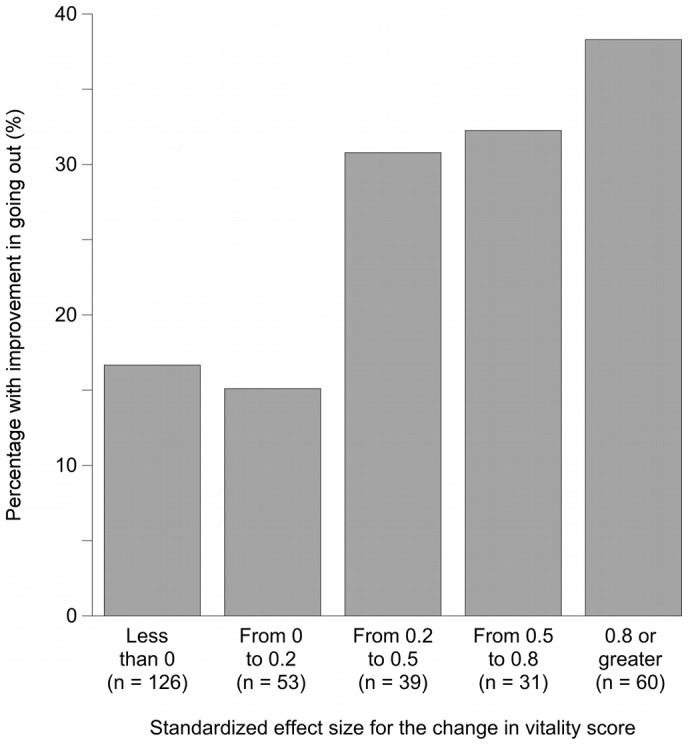
Figure 1. Relationship between the SES categories of changes in VT scores and the proportion of participants who had improvement in the frequency of going out.

Comparing the group with the greatest increase in VT score to the group with a decrease and to the group with almost no increase, the Figure shows that more than twice as many people in the former group reported improvement in their frequency of going out. That is, groups with greater increases in VT scores had more peole who reported increases in the frequency of going out.
