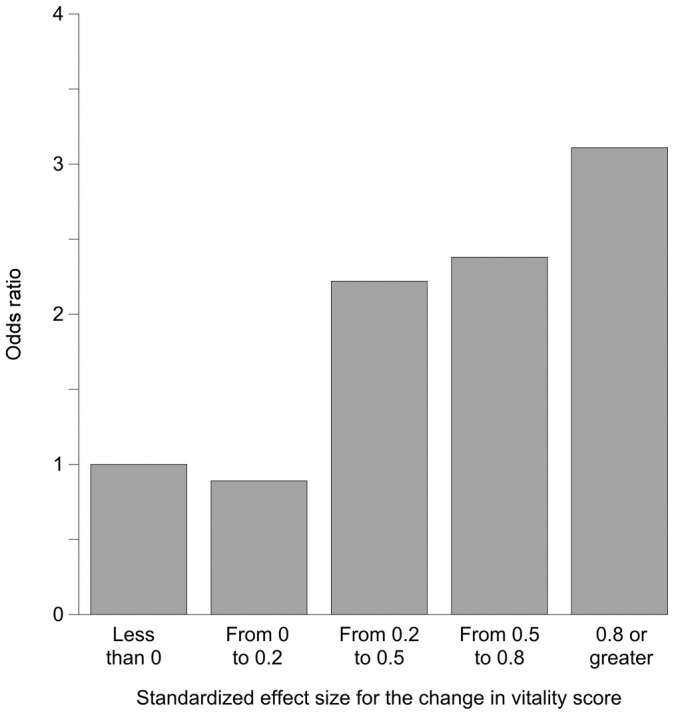
Figure 2. Association between changes in VT scores and changes in the frequency of going out.

The independent variable is the categories of SES (SES of “<0” as the reference standard). This Figure shows the results from model C2, in which the change in VT score was the only independent variable. Greater changes in VT scores were clearly associated with going out more frequently.
