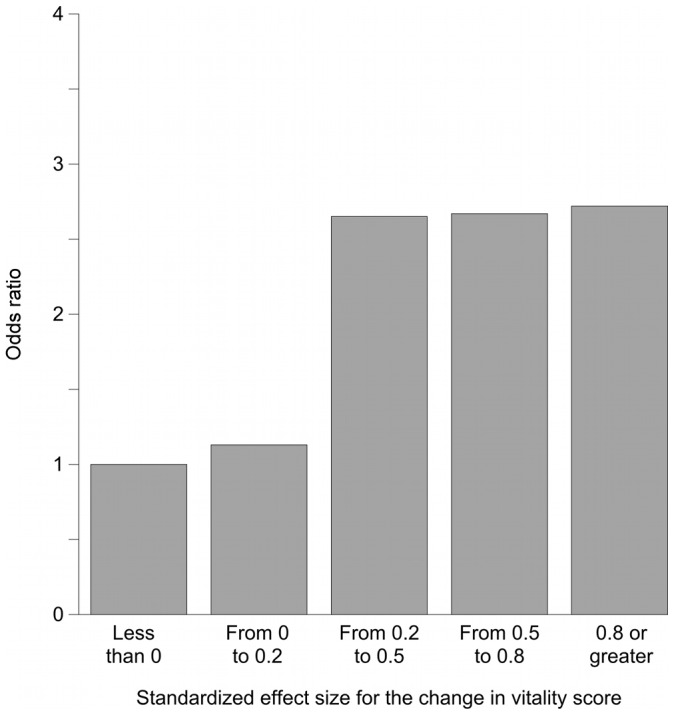
Figure 4. Association between changes in VT scores and changes in the frequency of going out.

The independent variable is the categories of SES (SES of “<0” as the reference standard). This Figure shows the results from model E2, which was same as Model D2 except that patients whose values were at the floor at baseline were excluded. Compared with the results of model E2 (Figure 3), the most noteworthy difference is that the magnitude of the association was somewhat attenuated in the highest of the four categories of VT increase. We interpret this result as indicating that the strong association between increases in VT scores and increases in the frequency of going out was not caused by regression to the mean.
