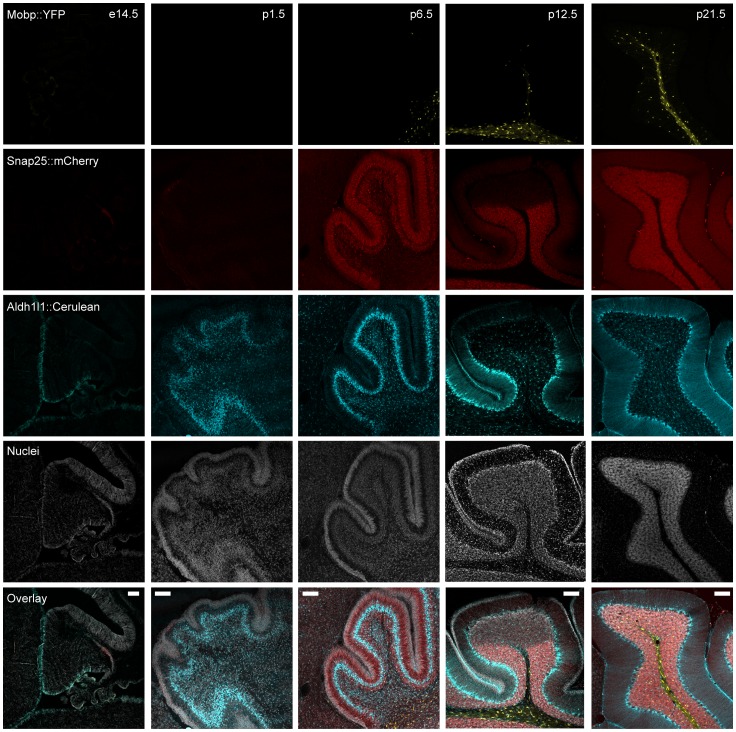
Figure 4. Cerulean, mCherry, and YFP transgenes each show independent temporal expression.
Confocal fluorescent microscopy of Prism JD1849 mice cerebellums at five different stages of development shows a distinct ontogeny for each fluorophore, consistent with the known developmental expression patterns of the endogenous genes Snap25, Aldh1L1, and Mobp. Colors as Figure 3 . Scale bars – A–D, 20 microns, E, 100 microns.

