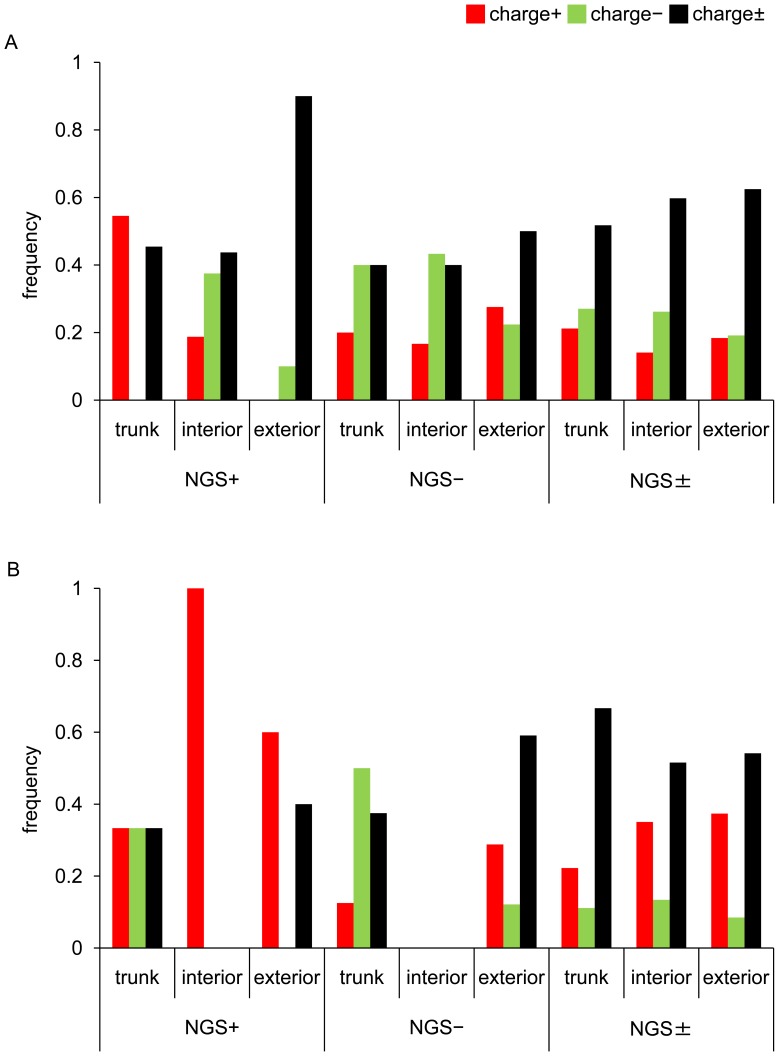
Figure 2. Patterns of amino acid substitutions in HA1 on different branches of phylogenetic trees.
The proportions of charge+ (red bar), charge− (green bar), and charge± (black bar) substitutions in HA1 on the trunk, interior, and exterior branches of the NGS+, NGS−, and NGS± branches are indicated for (A) A/H3N2 and (B) A/H1N1 viruses. The number of amino acid substitutions in HA1 is shown in Table S1.

