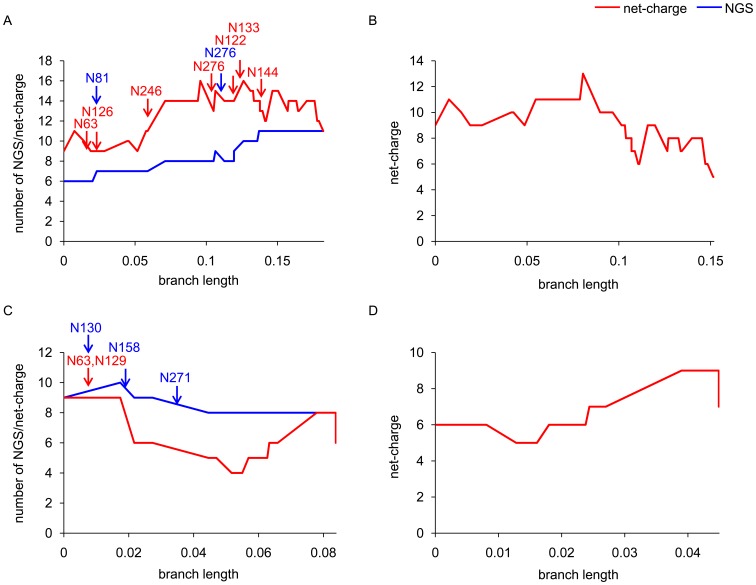
Figure 4. Net-charge and number of NGS in HA1 on the trunk branches.
The sums of changes in the net-charge (red line) and the number of NGS (blue line) in HA1 from the root to each node along all trunk branches (A: A/H3N2 virus; C: A/H1N1 virus) and that in the net-charge along NGS± trunk branches (B: A/H3N2 virus; D: A/H1N1 virus) were plotted against the total branch length from the root to the node. The red and blue arrows indicate the trunk branches where gains and losses of NGS occurred in HA1, respectively, with the amino acid positions of NGS.

