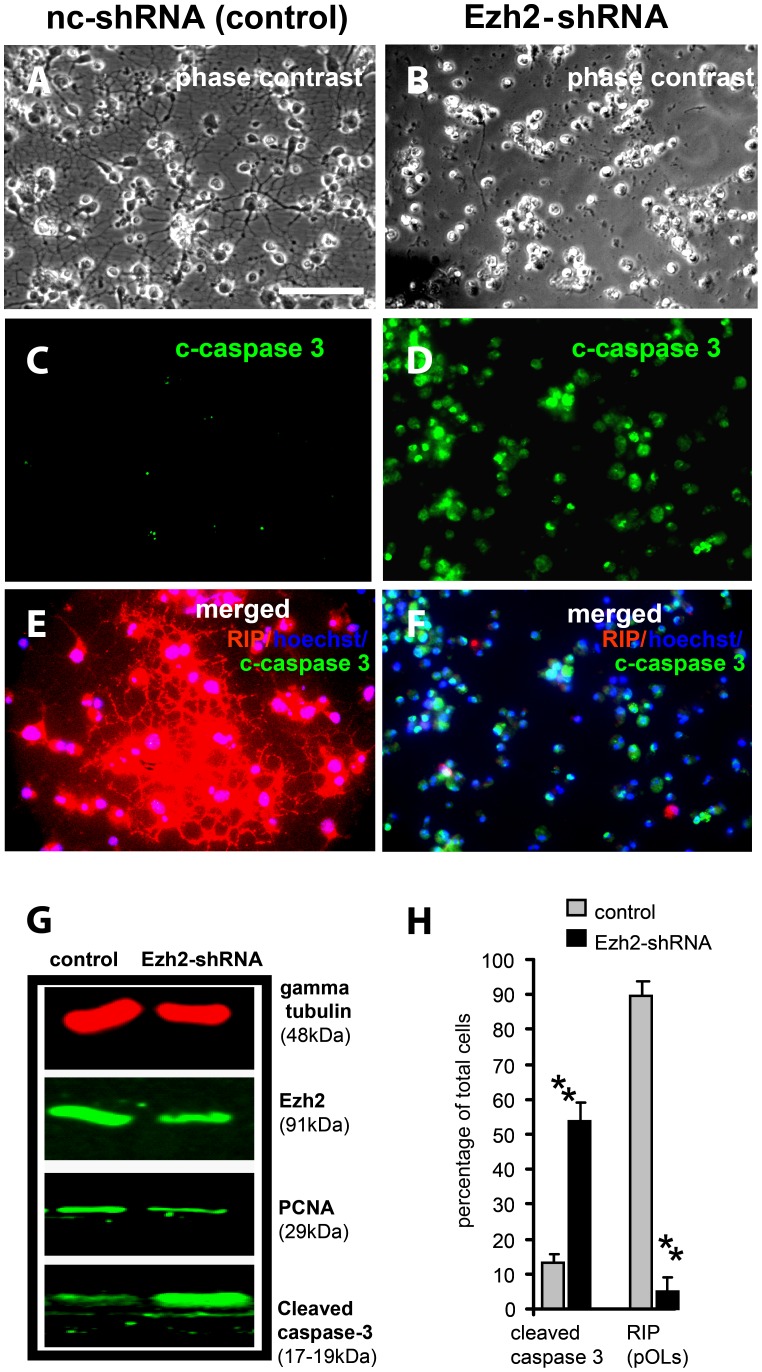
Figure 6. Acute suppression of Ezh2 induces apoptosis in pOLs.
(A, B) Phase contrast images show that pOLs retract their projections when treated with Ezh2-shRNA. (C, D) Immunostaining for apoptosis marker, cleaved caspase 3 (green) shows increase in cell death in pOLs cultures treated with Ezh2-shRNA compared to control cultures (nc-shRNA). (E, F) Co-immunostaining using anti-cleaved caspase 3 and anti-RIP (an oligodendrocyte maker) shows restriction of cell extensions and increased cell death, in cultures treated with Ezh2-shRNA. (G) Western blot of protein samples prepared after 24 hours of transfection shows a decrease in Ezh2 and a strong increase in cleaved caspase 3 bands in pOLs treated with Ezh2-shRNA, compared to the cultures treated with nc-shRNA (control). PCNA (a proliferation marker) expression remained about the same in both conditions. (H) Quantification of apoptotic (cleaved caspase 3-positive) and differentiating (RIP-positive) cells in Ezh2-shRNA treated and control (nc-shRNA) pOLs. Bar graphs represent mean of three independent experiments ± S.D. (Calibration bar in (A) represents 100 micrometers, which is valid for all the photomicrographs (A–F); ** in (H) represents p<0.01).

