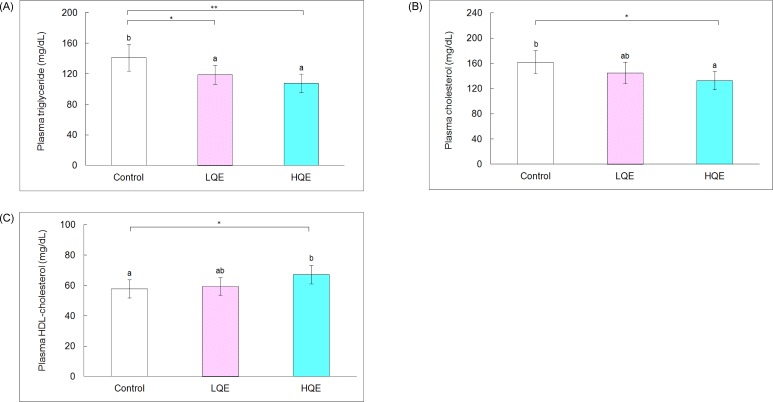
Fig. 2.
Plasma lipid profile of db/db mice. A, Plasma triglycerides; B, Plasma total cholesterol; and C, Plasma HDL-cholesterol. The control group was fed AIN-93G diet, whereas the low and high quercetin (LQE and HQE) groups were fed a diet containing 0.04% and 0.08% quercetin for 6 weeks. Values are mean ± SD (n = 6). Each bar with different letters is significantly different (*P < 0.05, **P < 0.01).

