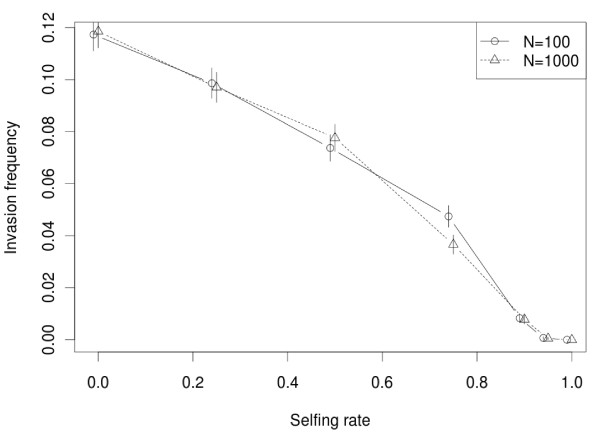
Figure 1.
Effect of selfing rate on the probability of invasion. Initially, each population has only one full active copy. The probability of adaptive insertion was fixed to Ps > 0 = 0.1%, this parameter does not affect the pattern (data not shown). The Y -axis is the percentage of invasion achieved (the frequency of the simulations with at least 1 copy per individual on average at generation 100), and the X-axis is the selfing rate (Z). Two population sizes were tested (N = 100 and N = 1000). The error bars represent the maximum-likelihood 95% confidence intervals, calculated assuming a binomial distribution of the invasion probability.

