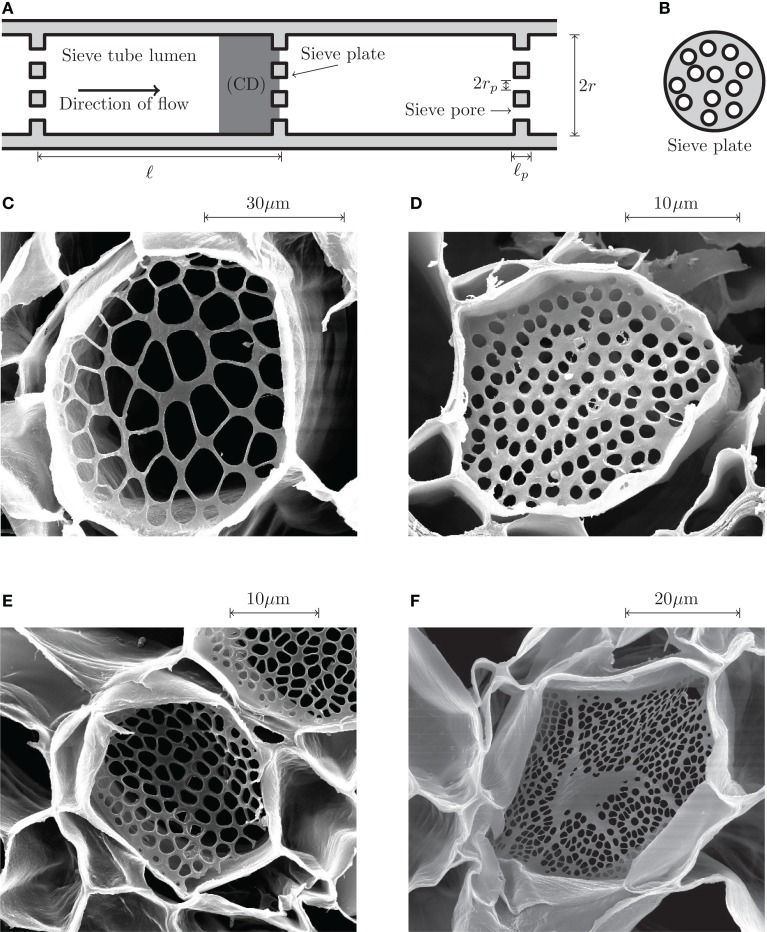
Figure 1.
Phloem sieve tube geometry. (A) Schematics of a sieve tube. Adjacent sieve tube cells of length ℓ and radius r are separated by thin sieve plates of thickness ℓp perforated by small holes of radius rp known as sieve pores. The computational domain (CD) used in the numerical simulations is highlighted in dark gray. (B) Schematic end view of a sieve plate. On average, about 50% of the sieve plate area is covered by open pores. (C–F) Scanning electron microscope (SEM) images of sieve plates. (C) Cucurbita maxima (Squash). (D) Phyllostachys nuda (Bamboo). (E) Phaseolus vulgaris (Green bean). (F) Ricinus communis (Castor bean). As shown in Figure 2, the sieve pore radius rp is normally distributed with a standard deviation σp of approximately 25% of the mean value See Mullendore et al. (2010) for details on SEM imaging.

