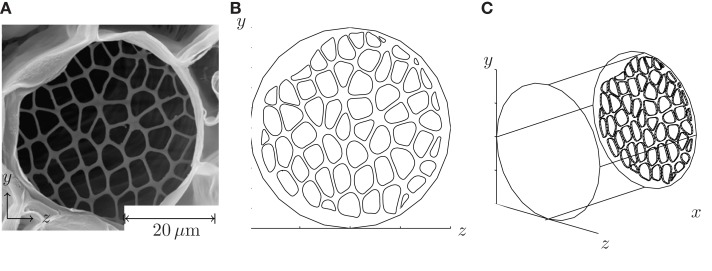
Figure 3.
Procedure for setting up numerical simulations of flow in sieve tubes. In (A), a SEM image of a sieve plate found in Cucurbita maxima is shown. From Mullendore et al. (2010), reproduced with permission. (B) Front view of the pore structure extracted from (A). (C) The plate has been place inside a cylindrical tube, cf. the computational domain shown in Figure 1A.

