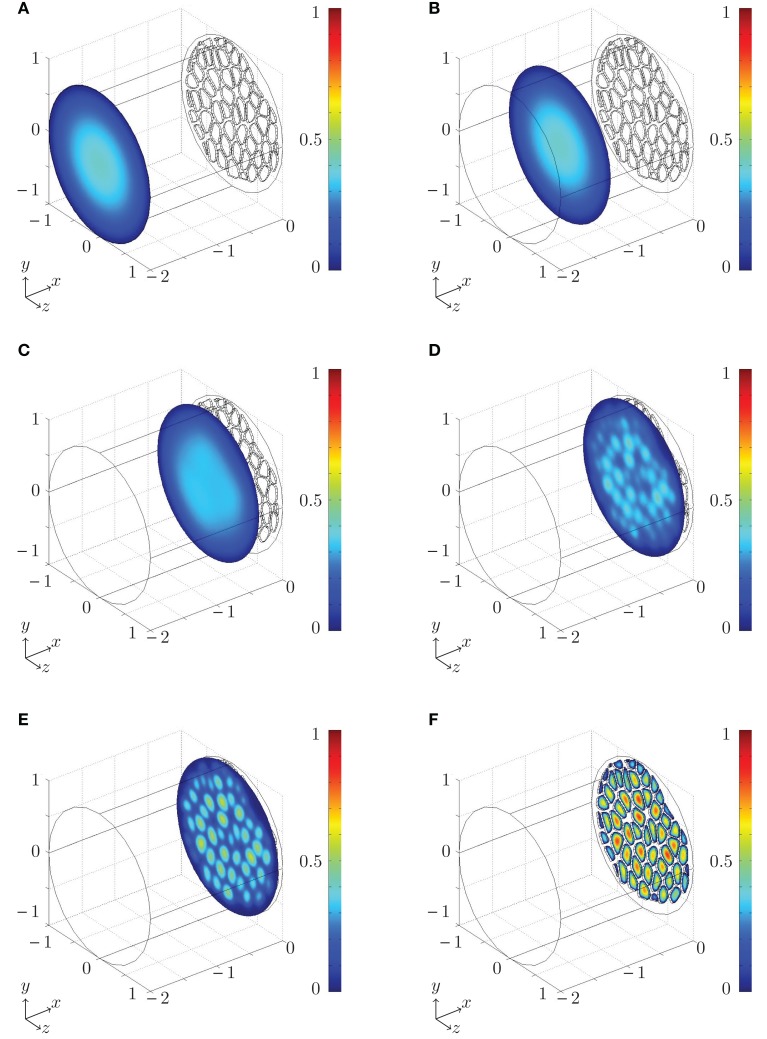
Figure 4.
Numerical simulation of the flow close to a Cucurbita maxima sieve plate set up using the procedure described in Sec. 2.3 and Figure 3. Color plot of the magnitude of the flow velocity |u| (from blue = 0 to red = 1 in arbitrary units). The liquid is moving from left to right. In (A–F), the non-dimensional distance x from the sieve plate (in units of the tube diameter) at which the cross sections are taken is x = −2, −1.25, −0.36, −0.13, −0.07, 0.025. The flow profile in (A,B) is the familiar parabolic profile found in conventional pipe flows. (C–E) The flow is distorted progressingly more for diminishing distance to the sieve plate where (F) the fluid passes through the pores. See Movie S1 in Supplementary Materials and Appendix B for further details.

