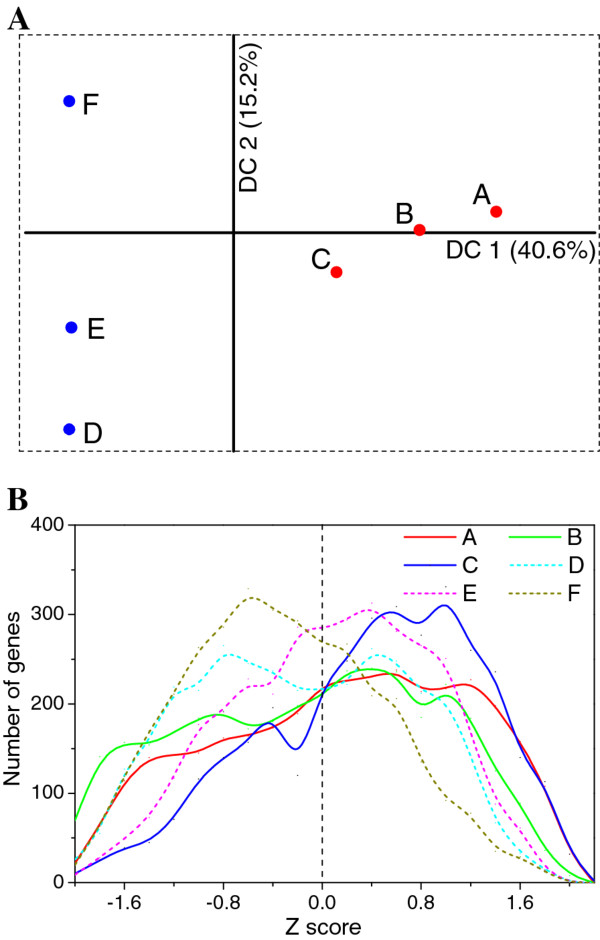
Figure 2.
Overall gene transcription profiles during the fermentation based on RNA-Seq data. (A) Detrended Correspondence Analysis (DCA). Sampling points from exponential phase and transition phase (A-C) were indicated in red, while points from stationary phase (D-F) were indicated in blue. (B) Gene distribution based on Z-score analysis. Samples A-F were indicated by different line styles and colors.

