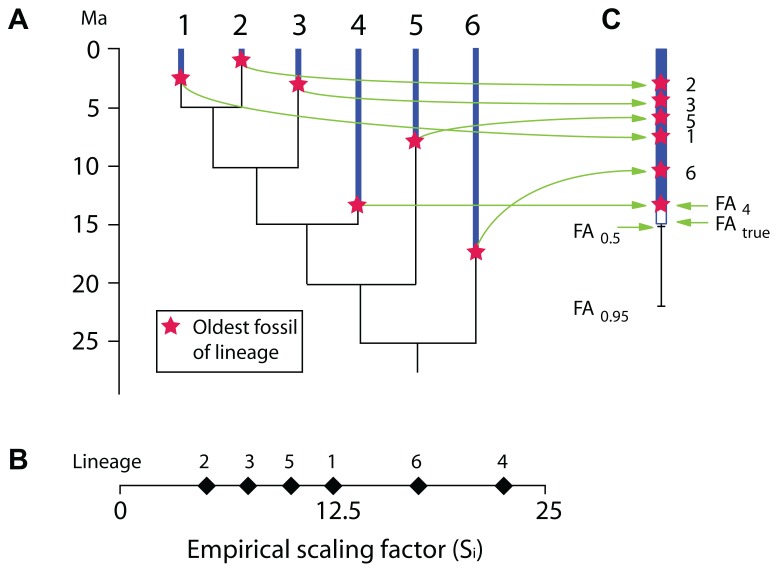
FIGURE 5.
Hypothetical example illustrating the basic principles of Marshall’s (2008) method for calculating confidence intervals on the appearance of taxa based on their fossil record and an uncalibrated ultrametric molecular tree. (A) Ultrametric molecular tree with stratigraphic range of known fossil record of each terminal branch. (B) Empirical scaling factor (Si) for each of the six terminal lineages. In this hypothetical example, the true (unknown) root age is 25 Ma. (C) Same, shown vertically, along with the 50 and 95% confidence intervals on the first appearance (FA) of the lineage with the highest Si (lineage 4) if we assume that a single fossiliferous horizon is known for each of the six terminal lineages.

