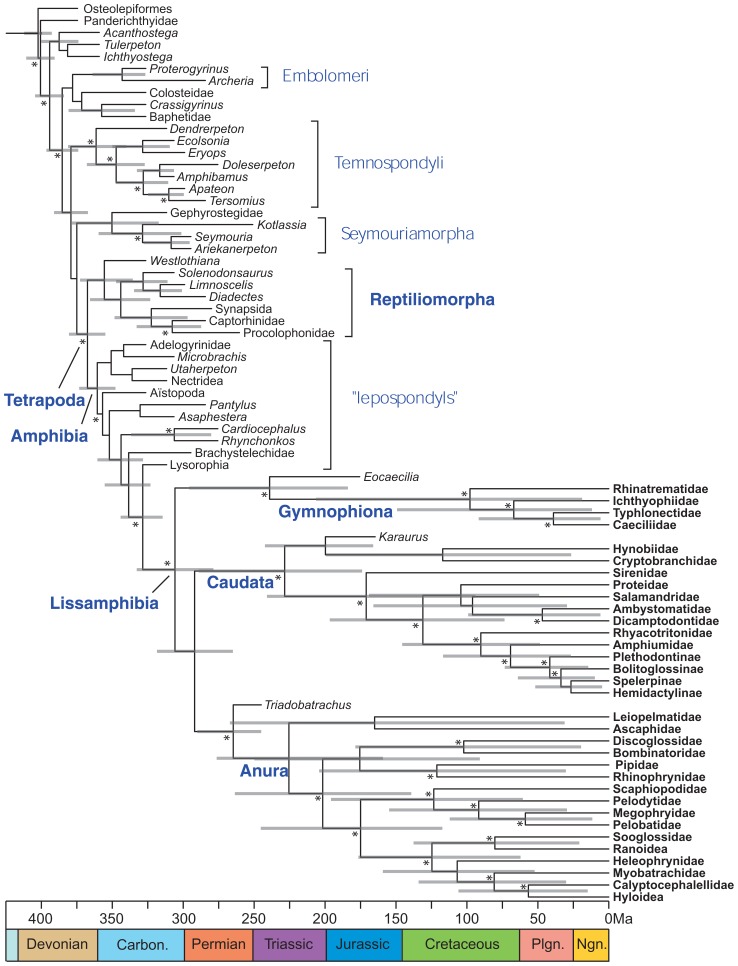
FIGURE 7.
Combined molecular and morphological timetree of limbed vertebrates. Modified from Pyron (2011). Gray bars represent 95% highest posterior density. Nodes without bars are represented by less than 50% posterior probability (Pp). Nodes supported by Pp > 95% are marked by an asterisk (*). Extant taxa are in bold type. Carbon, Carboniferous; Ngn, Neogene; Plgn, Paleogene

