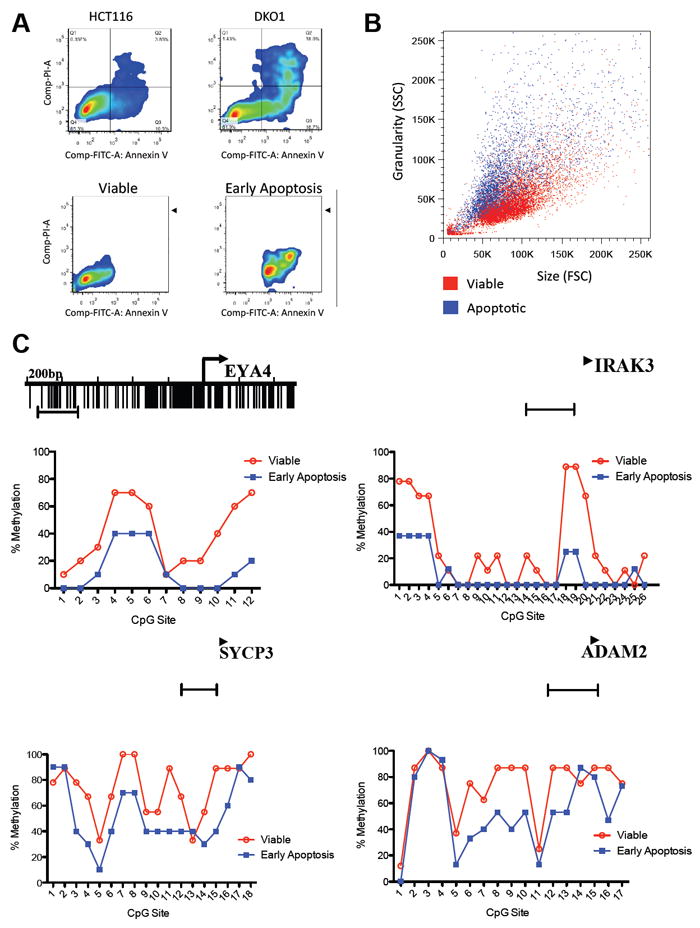
Figure 4. Apoptosis analysis of HCT116 and DKO1 cells. See also Figure S2.

(A) HCT116 wild type and HCT116 DKO1 cells were stained with annexin V-FITC and Propidium Iodide (PI) and analyzed by FACS, showing an increased level of basal apoptotic cell death in the HCT116 DKO1 cell line compared to HCT116 wild type. HCT116 DKO1 cells were then sorted in viable (annexin V and PI negative) and early apoptosis (annexin V positive and PI negative).
(B) The morphology of viable DKO1 and early apoptosis is clearly distinct. The apoptotic cells (blue) show a characteristic phenotype of higher SSC and lower FSC than the viable cells (red).
(C) Bisulfite sequencing analysis of CpG methylation status of four regions, from cancer-specific methylated cluster (EYA4 and IRAK3) and from somatic tissue-specific DNA methylation cluster (SYCP3 and ADAM2). The mean percent methylation at each CpG site is derived from clones showed on Figure S2A. The capped line represents the region analyzed.
