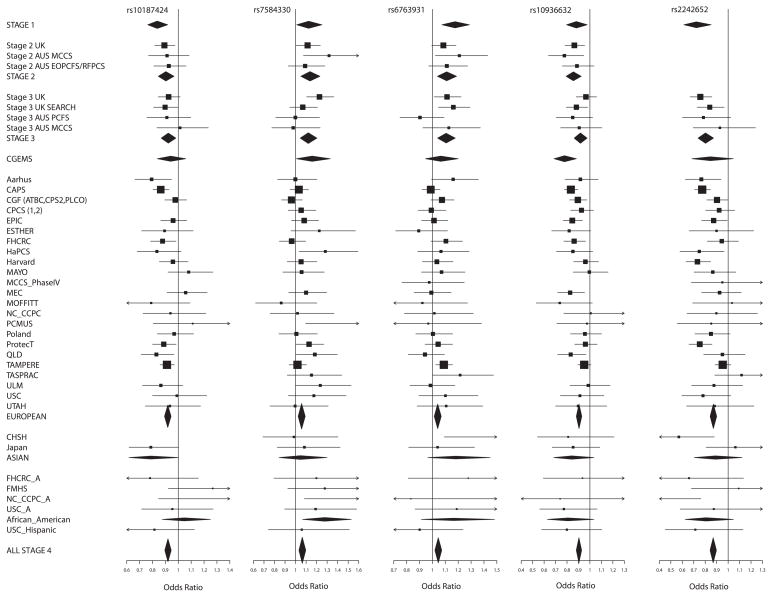
Figure 1.
Forest plots for the 10 SNPs genotyped in stages 1–4. Squares represent the estimated per-allele odds ratio (OR) for individual studies. The area of square is inversely proportional to the precise of the estimate. Diamonds represent the summary OR estimates for the subgroups indicated. Horizontal lines represent 95% confidence limits.


