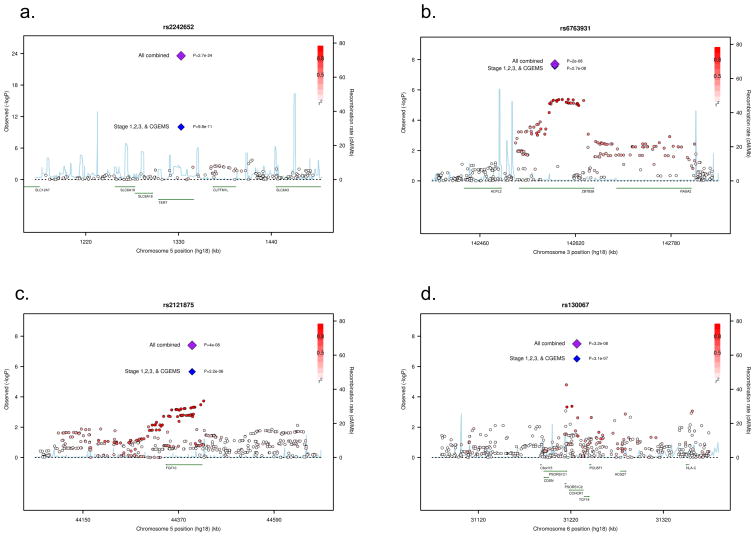
Figure 2.
Regional plots of four of the associated SNPs at 5p15 (a.), 3q25 (b.), 5p12 (c.), and 6p21 (d.). Plots show the genomic regions associated with PrCa and −log10 association P values of SNPs. Also shown are the SNP build 36/hg18 coordinates in kilobases, recombination rates and genes in the region. The intensity of red shading indicates the strength of LD (r2) with the index SNP. Plots drawn with a modified Rscript from http://www.broadinstitute.org/mpg/snap/ldplot.php

