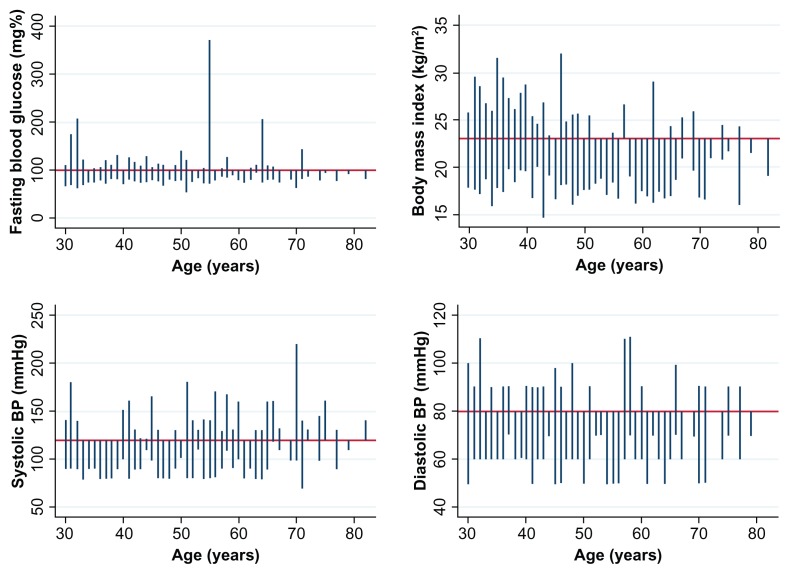
Figure 2.
Two-way spike plot diagram showing distribution of persons at risk according to blood pressure, fasting blood glucose, and body mass index in the sample population, (n = 298).
Notes: The cutoffs were a body mass index of 23 kg/m2, fasting blood sugar of 100 mg%, systolic blood pressure 120 mmHg and diastolic blood pressure 80 mmHg.

