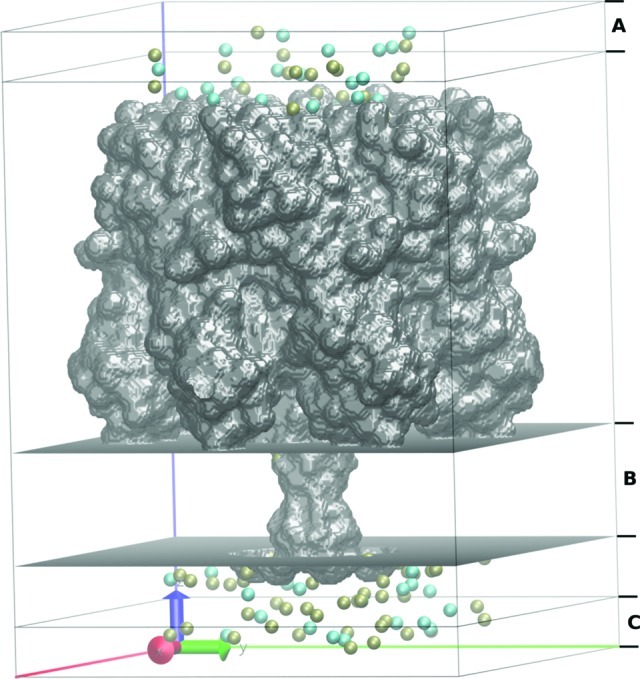
Figure 1.

Molecular graphics view of the orthorhombic simulation box in GCMC/BD of the α-hemolysin pore bathed in a 0.3 M KCl solution. K+ (tan) and Cl– (cyan) ions are located in the pore and in the buffer regions (A and C regions). Transmembrane zone is shown as region B.
