Figure 3.

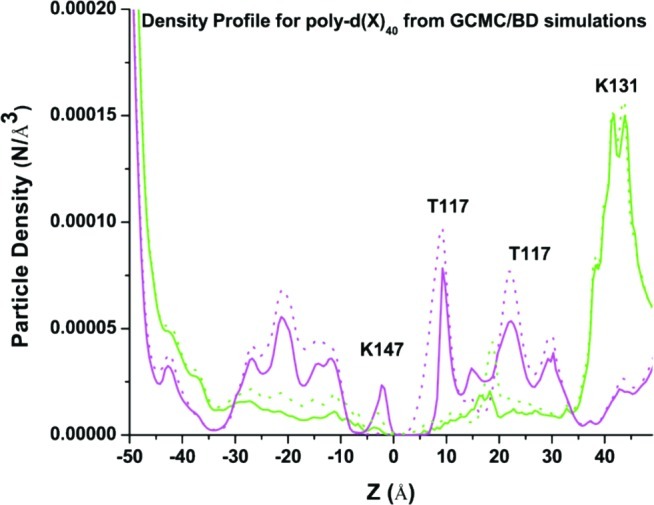
Ion density along the pore stem from GCMC-BD simulations with coarse-grained models of 5′-poly d(A)40-3′ (shown in solid lines) and 5′-poly d(C)40-3′ (shown in dotted lines) for K+ and Cl– show in magenta and green, respectively.

Ion density along the pore stem from GCMC-BD simulations with coarse-grained models of 5′-poly d(A)40-3′ (shown in solid lines) and 5′-poly d(C)40-3′ (shown in dotted lines) for K+ and Cl– show in magenta and green, respectively.