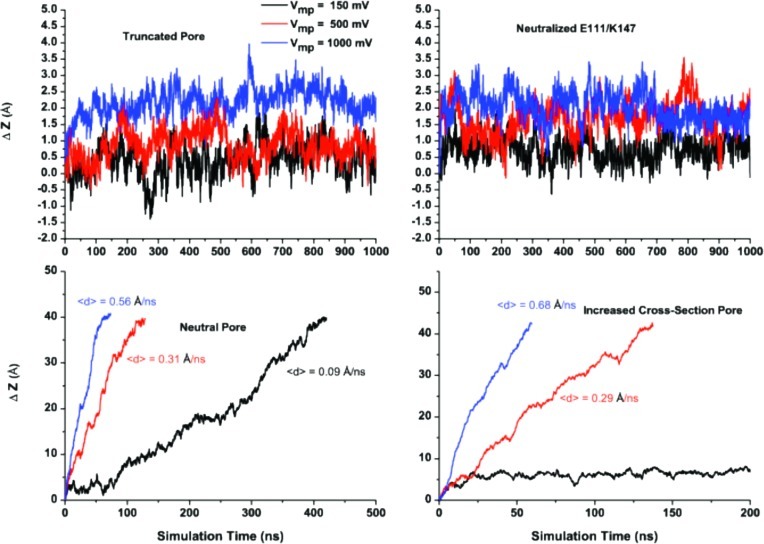
Figure 7.
Effect of the pore confinement on the voltage-dependence of translocation. Top: Time series for the polymer displacement as a function of applied voltage along the z axis of the truncated pore fully charged and with the neutralized first constriction zone, e.g., E111/K147 are shown on the left and right panels, respectively. Bottom left: Voltage-dependence of the DNA displacement in the neutralized pore. Velocity was determined from a linear fit of the time series for displacement. Bottom right panel: Same with an increased pore cross-section. The stern radius assigned to every atom has been scaled down by 50%, while all of the partial charges were kept on the amino acids forming the pore.

