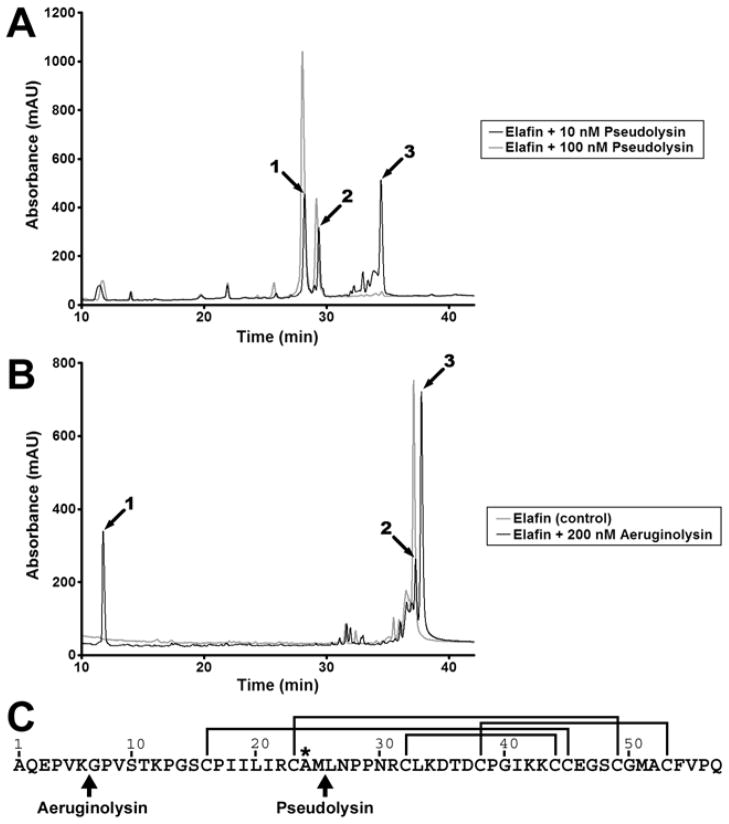
Figure 5. HPLC-mass spectrometry analysis of elafin incubated with pseudolysin and aeruginolysin.
Recombinant elafin (3 μg, 25 μM) was incubated with various concentrations of pseudolysin or aeruginolysin for 2h at 37°C. Samples were then analysed by reverse phase HPLC coupled to electrospray mass spectrometry. (A) HPLC analysis of elafin incubated with 10 nM (black line) and 100 nM (grey line) pseudolysin. (B) HPLC analysis of elafin incubated alone (grey line) or with 200 nM (black line) aeruginolysin. (C) Identification of the cleavage sites in elafin. The amino acid sequence of elafin is represented from the amino-terminus (Ala1) to the carboxy-terminus (Gln57). The lines indicate the position of the disulphide bridges and the asterisk identifies the residue in P1 position within the protease-binding loop. Arrows highlight the cleavage sites generated by pseudolysin (at Met25-Leu26) and aeruginolysin (at Lys6-Gly7).

