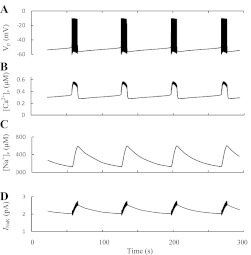
Fig. 6.
Slow [Na+]c changes as a pacemaker. Typical computer simulations using the model by Fridlyand et al. (51). Slow bursting and the oscillation patterns of Ca2+ and Na+ are illustrated. The other slow variables were frozen ([ATP] = 3,300 μM, [IP3] = 3 μM, and [Ca2+]ER = 50 μM) at constant levels to eliminate other mechanism of [Ca2+]c oscillations. All other parameter settings are as in Ref. 51. A: VP. B: [Ca2+]c. C: [Na+]c. D: INaK.

