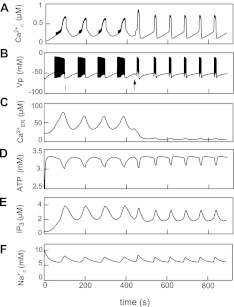
Fig. 7.
Simulation of glucose-induced slow oscillations and SERCA blocking. Glucose-induced slow electrical bursting and [Ca2+]c oscillations were simulated at a step increase of the rate constant of ATP production from a low to an intermediate value at t = 0. A: [Ca2+]c. B: MP. C: Ca2+ in ER. D: cytosolic ATP. E: cytosolic IP3. F: intracellular Na+ concentration. For simulation of thapsigargin action, the maximal rate of ER (SERCA; PCaER) was decreased from 0.105 to 0.013 μM/ms at arrow in B (adapted from Ref. 51).

