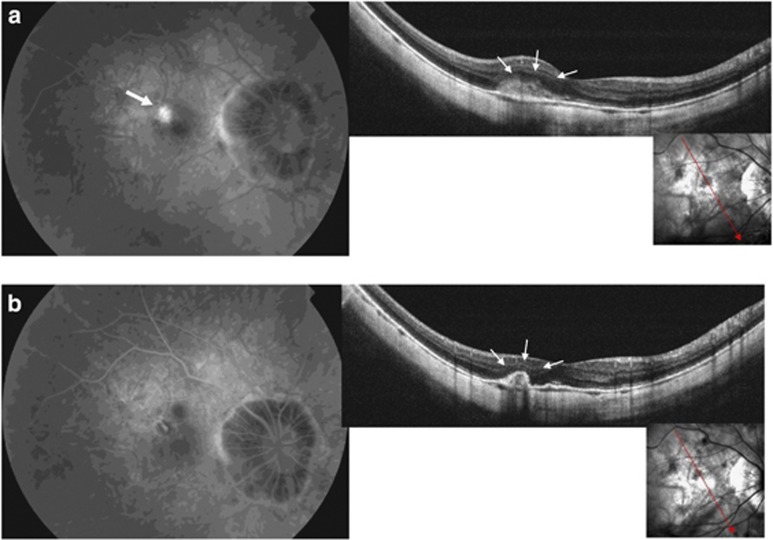
Figure 1.
(a) An active leaking CNV is visible at baseline on FA (top left, white arrow). Baseline SD-OCT scan shows the hyper-reflective area with fuzzy borders above the RPE (fuzzy area) corresponding to the CNV (top right, small arrows). (b) At month 1, no CNV leakage on FA is detectable (bottom left). SD-OCT scan shows the disappearance of the fuzzy area and a marked thickening of the hyper-reflective line corresponding to the RPE (bottom right, small arrows).

