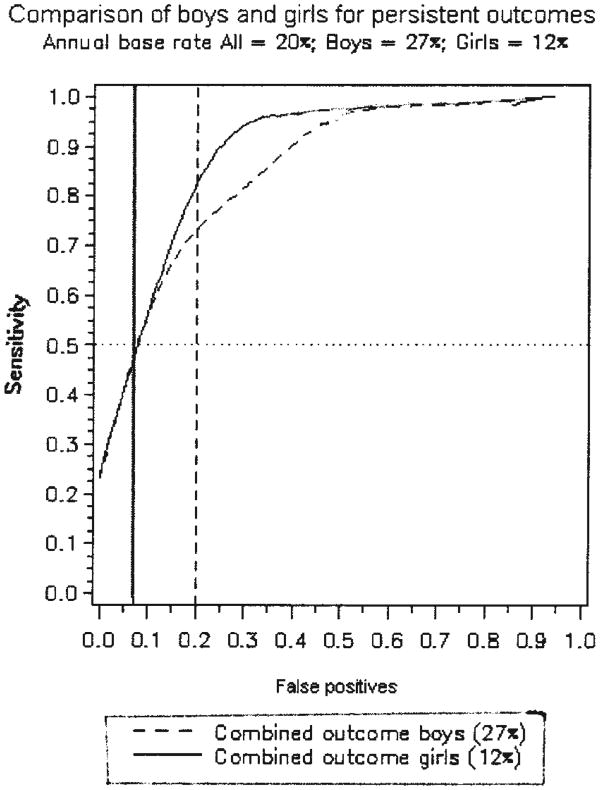
Figure 1.
Test characteristics for boys and girls at 20% overall base rate (12% of girls and 27% of boys classified as at risk). The horizontal line indicates the point at which sensitivity is.50. The dotted vertical line indicates a specificity for boys of.80 (the point at which positive predictive value is equal to or greater than.50 when the base rate is 27%). The solid vertical line indicates a specificity for girls of.93 (the point at which positive predictive value is equal to or greater than.50 when the base rate is 12%). The portion of the curve in the upper left quadrant (for boys) represents decision thresholds that meet the criteria for accuracy set by Bennett et al. (1998). No portion of the girls' curve is in the girls' upper left quadrant.

