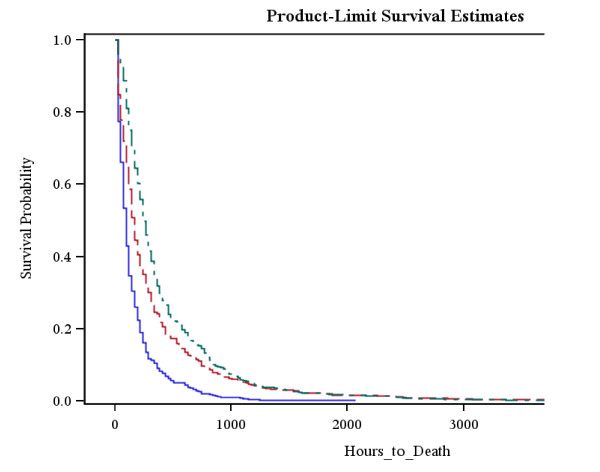
Figure 4.
Time to Death Curves. Patients who were never Lymphopenic displayed the shortest average time to death. Patients with lymphopenia which returned to normal in the first 4 days displayed the longest average time to death. Group 1 = (green dashed line) Ever Lymphopenic = 1; Back to Normal = 1; Group 2 = (red dashed line) Ever Lymphopenic = 1; Back to Normal = 0; Group 3 = (blue dashed line) Ever Lymphopenic = 0; Back to Normal = 0;

