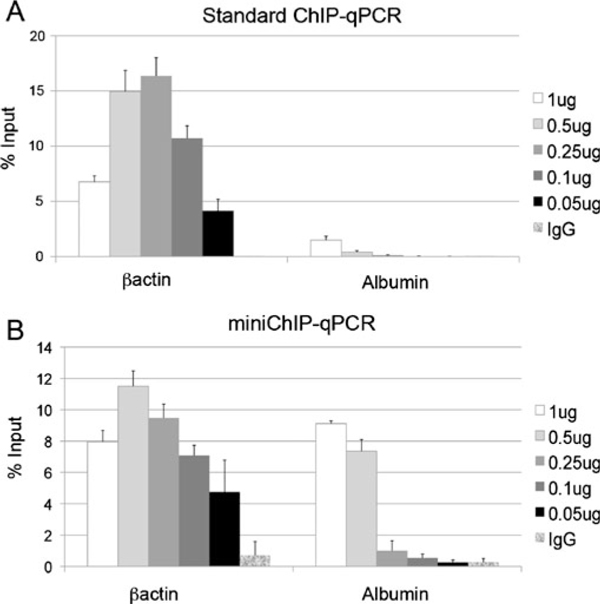
Figure 2.
Titration analysis of an anti-H3K4me3 antibody in standard and scaled miniChIP assays. Assessment of the anti-H3K4me3 antibody (Upstate 04-745) in standard ChIP (a) and miniChIP (b) assays using the βactin and albumin promoters across a titration range of 1–0.05 μg. Standard and miniChIP assays were optimized for the analysis of 1 × 10⁶ and 10,000 cells per reaction, respectively. H3K4me3 enrichment is represented as % input at gene promoters (y-axis) obtained from the murine embryonic fibroblasts. % input was determined as described in "Materials and Methods", and was used for the analysis of ChIP–qPCR data in all subsequent figures. Low background signals were detected with the IgG control sera at both βactin and albumin promoters. Error bars represent the standard deviation (±SD) of at least three independent ChIP assays.

