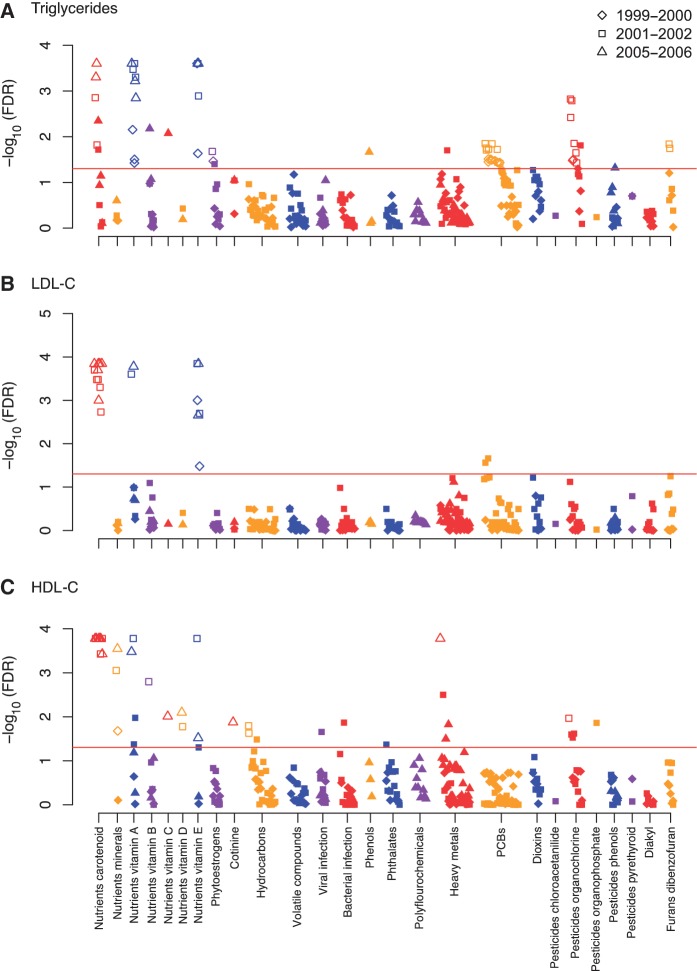
Figure 3.
Significance of association [−log10(FDR)] for each of 188 factors by survey in association to (A) triglycerides, (B) LDL-C, (C) HDL-C. Y-axis indicates −log10(FDR) of the adjusted linear regression coefficient for each of the environmental factors. Colours represent different environmental classes as represented in Figure 1A. Red line corresponds to an FDR of 0.05. Findings validated in the 2003–04 survey are seen in the open markers

