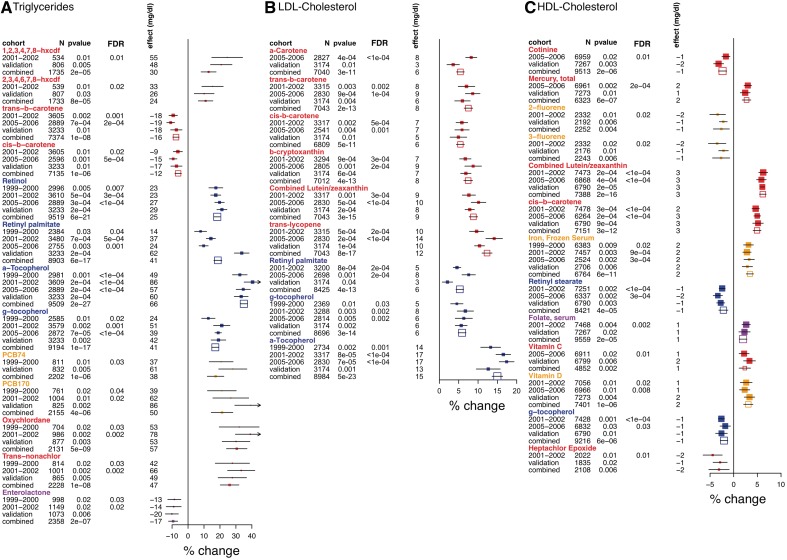
Figure 4.
Forest plots for validated environmental factors associated with (A) triglycerides, (B) LDL-C, (C) HDL-C. Survey (labelled as 1999–2000, 2001–02, 2005–06, filled points) denotes the NHANES survey in which the specific factor was found to be significant (FDR < 0.05) in a model adjusting for age, age2, SES, ethnicity, sex, BMI. ‘Validation’ indicates the estimates found for the significant factor in the validation survey. Combined survey (unfilled points) denotes the estimate attained when combining all surveys available for exposure in a model adjusting for age, age-squared, SES, ethnicity, sex, BMI, waist circumference, type 2 diabetes status, blood pressure and survey. Percent change (x-axis) is the percent change of lipid level for a change in 1 SD of logged exposure value. Effect size (in mg/dl) attained when fitting the untransformed lipids to the model. Symbols proportional to sample size and colours represent different environmental classes as represented in Figure 1A. For triglycerides and HDL-C, only the top most significant factors for each factor class is shown; forest plots of all validated factors are seen in Supplementary Figure 1, available as Supplementary Data at IJE online

